
The Future Is Smart
Virtually every sector of the modern economy relies upon technology to improve quality, productivity and profitability—including the promotional products industry. In 2017 alone, 23.2 percent of distributor sales were conducted online, accounting for more than $5.4 billion in technology-driven spending, according to PPAI’s most recent Sales Volume Study.
Over the past 25 years, the promotional products industry has become increasingly digital. In fact, 99 percent of industry companies have a website, according to the latest 2018 PPAI Business Study, “Technology Report”, conducted this spring, which surveyed more than 500 technology decision makers. The Association first conducted the study in 2011 and last updated it in 2015. This year’s study included a quantitative survey of PPAI members and nonmembers to assess the evolving role of tech in promotional products businesses.
Today, technology is firmly integrated within the business enterprise, and it is a growing part of business expenditures. In general, the role of IT can be classified into four major activities: 1) enterprise 2) embedded 3) customer and 4) process. Each activity fulfills a different objective within the company.
Enterprise activities provide IT services across the company and manage the IT unit and vendors; embedded activities involve work with non-IT peers that focuses on strategy, business process, execution and innovation, new product development and compliance; customer activities involve work with external customers or partners to sell and provide IT-enabled products and services; and process activities manage non-IT tasks such as sourcing, facilities, operations and shared services.
This year’s survey asked budget-related questions of respondents who identified themselves as decision makers in the technology buying process. Results reveal comparable spending trends between supplier and distributor companies, with the average company investing approximately nine percent of its total revenue on technology each year. Companies with less than $1 million in total sales revenue spent 10 percent, or upwards of $100,000, on technology (Millennial-owned companies with less than $1 million in total sales revenue spent 21 percent). Companies with total sales revenue between $1 million and $500 million spent six percent, or up to $30 million, on technology, and companies with total sales revenue at $500 million or more on average spent two percent, or more than $20 million, on technology.
Industry budget benchmarks are useful for understanding the impact of market conditions on spending trends; however, as technology investments continue to grow, today’s rapidly evolving, competitive business landscape demands that companies realign budget allocations across business functions, business strategy and incremental business change.
Unraveling the distribution of technology by identifying categories of expenditures provides a more comprehensive framework that can be used to streamline business operations and ultimately enable top-line growth.
Analyses in a 2017 report, “Connected Small Businesses U.S.,” by management and consulting company Deloitte, show significant dividends can be gained from a sophisticated technology strategy. Technologically advanced small businesses earned twice as much revenue per employee as non-tech companies; experienced nearly four times the revenue growth over the previous year; and, had six times the average employment growth rate. Companies with greater engagement were also more likely to innovate through new product offerings, have more diversified customer bases and experience increased inquiries and customers across the sales funnel.
Where Are The Dollars Spent?
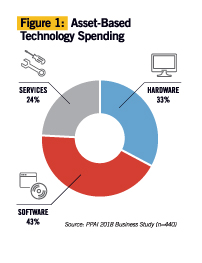
Technology is no longer isolated in siloed parts of the business—it spans a wide range of internal and external touchpoints. However, within the broader world of tech, technology investments generally fall into one of three categories: hardware, software and services. On average, supplier and distributor companies spend 33 percent on hardware, 43 percent on software and 24 percent on services (Figure 1).
The job of the technology professional is growing more and more complex, and both suppliers and distributors are adjusting the role of technology services in their business. Whether full operational responsibility is completely handed over to a third-party service provider or assumed by IT personnel within the enterprise, technology services expenditures cover both direct and indirect costs needed to support business operations and initiatives. This may include employee costs such as salary, benefits and training, or contract labor costs through third-party services.
The latest study findings indicate a growing IT presence at both supplier and distributor companies. In fact, 83 percent of suppliers and 70 percent of distributors invest in some form of service, whether it is employee or third-party driven. Since 2011, IT services have increased by 18 percent for supplier companies, and an astounding 141 percent for distributor companies (Figure 2).
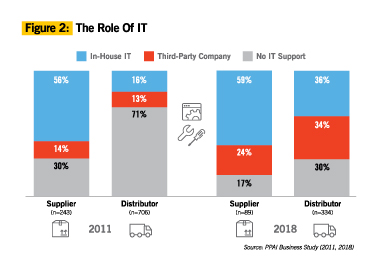
Rapid developments in the IT space also imply relatively quick shifts in the demand for skills and, as a result, 24 percent of supplier companies and 34 percent of distributor companies are outsourcing IT services in 2018—an effective approach to maintaining flexibility and agility as business conditions continually evolve. On the other hand, keeping long-term third-party services can be equally costly and limit process standardization, while an on-demand workforce bridges the gaps between business goals and technology requirements throughout the company.
Internal IT workforces within the promotional products industry operate at 59 percent of suppliers and 36 percent of distributors. Yet, further analysis reveals that, within this group, 60 percent of supplier companies and 81 percent of distributor companies employ part-time IT staff (Figure 2). This means the role of IT is shared among those with multiple priorities.
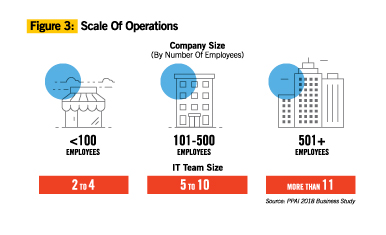
While only five percent of distributor companies have more than two IT professionals on staff, 15 percent of supplier companies are more likely to have a team. The threshold is better determined by company size, and firms with larger head counts (100 employees or more) are more likely to invest in technology-focused human capital (Figure 3).
The U.S. software sector is currently the main driver of the overall technology market, and associated costs may account for a combination of subscriptions, licenses or support contracts, typically with a set price on a fixed term. Software technologies may include applications, operating systems or middleware, which is software between the operating system and the end user.
Software was originally—and rightly—relegated to the domain of the IT department, but today it serves a multitude of functions for many different business units. The rising increase in process automation and workflow management solutions has not only led to an increase in enterprise productivity but has also radically reduced the cost of production and time to market.
The Rise Of Connected Products
The dynamics of business are evolving virtually at the speed of thought, so much so that futurist Gerd Leonhard foresees more change in the next 20 years than has occurred in the previous 300 years. For most of history, however, change has been sluggishly successive, and as Craig Nadel, CEO of distributor Jack Nadel International, says, “we have all made some really bad and some really good guesses.”
Though against our linear intuition, future predictions declaring exponential growth are illustrated by the fundamentals of Moore’s Law. Named after Intel co-founder Gordon Moore, the 1965 prediction suggests a dramatic increase in computing power and a decrease in relative cost at an exponential pace. Unlike linear growth, which results from repeatedly adding a constant, exponential growth is the repeated multiplication of a constant. Therefore, in contrast to a steady straight line over time, exponential growth produces an accelerating rate of change against a vertical axis. Often, exponential trends are missed in their early stages because the initial pace of exponential growth is deceptive — it begins slowly and steadily and is hard to differentiate from linear growth; hence, predictions based on the expectation of an exponential pace can seem improbable.
In practice, exponential trends do not last forever; however, the origins of Moore’s Law were devised parallel to the evolution of the transistor chip, a technology that is close to being phased out, and yet the law continues to be one of the most cited empirical laws to describe technological change.
A strong testimony can be taken from the 2018 Consumer Electronics Show (CES). For the first time, the world’s largest tech show featured a dedicated ‘Smart Cities’ exhibit area presented by the Consumer Technology Association (CTA) and Deloitte, representing an entire connected ecosystem and showcasing cutting-edge smart technologies. If this year’s CES underscored one thing, it’s that the next wave of growth and differentiation in consumer products will focus on smart, connected products.
The Internet of Things (IoT) is moving from theory to reality across the bulk of the business economy, including the promotional products industry. Each year attendees at The PPAI Expo are given name badges that give them access to the trade show floor. This year, however, the badges were equipped with data collection capabilities and diagnostic software features that monitored performance, behavior and the environment. Though limited to the trade show floor, this product, called eventBit, gathered data to help generate previously unavailable insights in real time, ultimately heightening both exhibitor and attendee experiences.
This is not a foreign concept for promotional products businesses. The ability to change the value proposition of a product or experience by enhancing one simple component is the core of the industry; a logo turns an ordinary product into a mode of communication for the brand it represents.
Today, the way products create value is being fundamentally transformed. With new components available, new functions are being developed to interact with products like never before. Unprecedented network access allows products to connect with people, systems, businesses and each other across a global Internet of Things. Technology allows us to stay in touch with our products, listen to them, and understand and capitalize on what they have to say to us. The very nature of products is changing, shaking up the traditional product value chain and making the most ordinary products connected and, therefore, “smart.”
In their Harvard Business Review article, “How Smart, Connected Products Are Transforming Competition,” authors Michael E. Porter and James E. Heppelmann identify three core elements that make a product “smart”: 1) Physical components that change the product design using mechanical and electrical parts; 2) Smart components that give the product a virtual identity, typically embedded in an operating system and accessed through an enhanced user interface; 3) Connectivity components that enable a wired or wireless connection with the product, whether installed, in the workflow or in the hands of the user.
Smart components amplify the capabilities and value of physical components, while connectivity components amplify the capabilities and value of smart products. The result is an ongoing cycle of value improvement.
Newly added components enable an entirely fresh set of product functions and capabilities. Each builds on the preceding, allowing smart products to monitor the product’s condition, external environment, operation and usage, control product functions and optimize product performance. It also allows autonomous product self-diagnosis and service, enhancement and personalization, as well as self-coordination with other products and systems. While each capability is valuable in its own right, a product can potentially incorporate all four components.
Products that were simply electronic were once considered “smart,” but now this label is expanding to everyday products. The Expo attendee badges are an example of how the smart revolution has already entered the mainstream—by the extension of ordinary products in our daily lives. Due to the falling price of IoT sensors and their increasing efficiency, the market for sensors in IoT devices is projected to grow at a compound annual growth rate of nearly 27 percent. In fact, the International Data Corporation (IDC) predicts more than 100 billion connected devices will be in service by 2025, generating revenue close to $10 trillion.
Though the “smart product” revolution is already under way, its footprint in the promotional products industry is still small. To explore this uncharted territory, the 2018 PPAI Business Study further questioned the state of smart product development to effectively navigate this evolving future landscape.
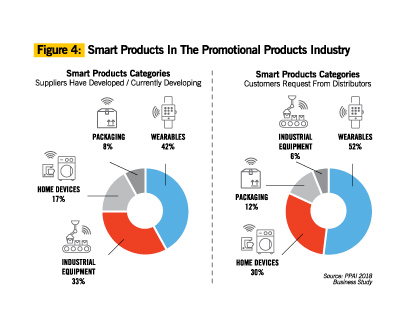
Results reveal that while only 17 percent of suppliers indicate they are developing home devices that are smart products, 30 percent of distributors say customers are requesting them. Not only is there a disconnect between supply and demand, but also in the types of products being developed (Figure 4).
Mark Abels, CEO of supplier SELCO, described his experience with smart watches as “moving slowly,” but having had some sales. “I think that is slowly changing, as people you might not expect to be interested are getting curious,” he says. “The watch will continue to evolve, and it may or may not find a bigger place in a connected world, but even if it doesn’t, people will continue to try to incorporate it. The real estate it occupies on millions of people is too good to ignore.”
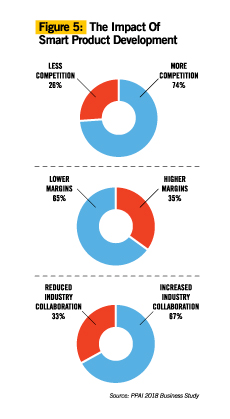
In these early stages of the smart product ecosystem, survey respondents foresee varying implications for the industry (Figure 5). On average, the majority believe the impact of smart product development means more competition (74 percent), lower margins (65 percent) and increased industry collaboration (67 percent). More than half (52 percent) say they expect no change to personal revenues or costs in the next three years, 38 percent anticipate an increase, and only 10 percent expect costs to decrease.
Smart products have extended the ability for providers and users to continuously monitor their status and environment; to react and adapt to conditions; to maintain optimal performance regardless of circumstances; and to actively communicate with the user, environment or other products and systems. In turn, smart products generate real-time data of an unprecedented variety and volume. Throughout the product lifecycle, opportunities abound to collect, sort and take action on data to improve manufacturing and distribution, as well as the overall customer experience.
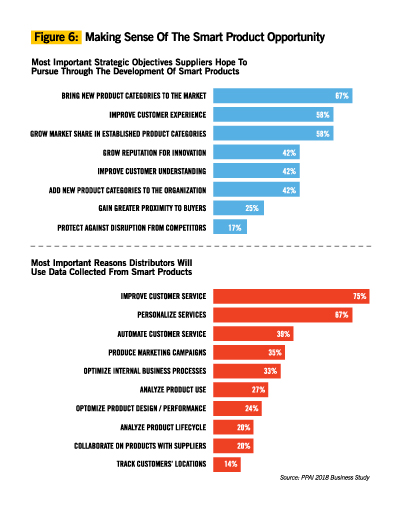
One of the more noteworthy, though somewhat counterintuitive, study findings shows that many distributor technology decision makers are keen to share data with suppliers to more effectively collaborate on product and service development and delivery (Figure 6).
Eric Granata, vice president of business development at distributor ROBYN, believes there are a number of caveats for suppliers and distributors to consider. “Should we offer solutions like these?” he posits. “How will it change our business? What about security, data privacy and ethics? Are there many in our industry (suppliers or distributors) who are ready to tackle that and risk their business to answer the question— ‘Was it worth it for the rest of us?’”
The IoPP (Internet of Promotional Products)
As a catalyst to new infrastructures, new monopolies, new politics and new economics, technology is changing who participates, how business is done, how rapidly competition moves and where the economic benefits are going and not going. The Internet of Things will soon become the Internet of Everyday Things, which will ultimately lead us to the Internet of Promotional Products. Though not likely to occur in the next five or even 10 years, as we move into an era where one generation’s technological advancements stand on the shoulders of the previous generation’s, the driving force behind Moore’s Law lives on.
Unlike the previous waves of technological transformation, IoPP is predicted to trigger more innovation, productivity gains and economic growth than ever before (Figure 7). Connected products will create opportunities that broaden the value proposition beyond the product itself, and growth will no longer be limited to physical product sales, but extend after the initial sale.
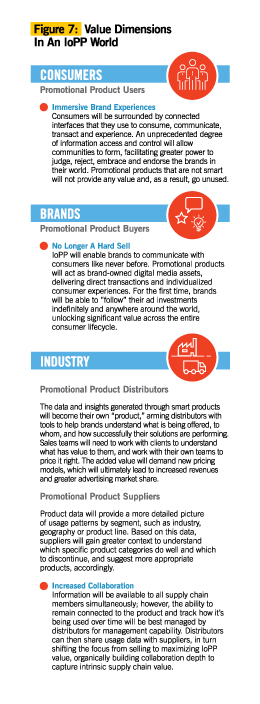
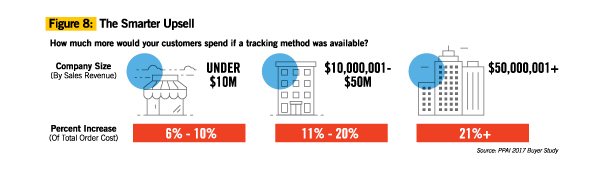
The IoPP will enable real-time communication between products and consumers, taking the guesswork out of advertising strategies, and customers are willing to pay a reasonable price as long as they can expect a high degree of value. The 2017 PPAI Buyer Study revealed 89 percent of decision makers at U.S. brands would spend more on promotional products if a tracking technology was offered in conjunction with them. On average, the majority indicated they would spend an additional 10 percent for that technology. Additionally, 41 percent of larger companies with $50 million or more in sales revenue reported they would spend upwards of 20 percent more on promotional products if tracking methods were made available (Figure 8).
Granata says, “Having this data would help us prove ROI to our clients. It would help us to sell more effective solutions faster without guessing which products are the most effective. It would help the industry by giving us the data to prove our worth and help our buyers make more informed decisions.”
A Smarter Future
Over time, the IoT space will mature and, much like the transistor chip, it too will fade into the infrastructure and interfaces of our lives. The smart product economy is commonly equated with technology; however, the IT sector falls short in measuring the complete scope, because as global management consulting firm McKinsey and Company noted, “Digitization, like electricity, is a general purpose technology that underpins a huge share of economic activity far beyond the sector that supplies it.”
Innovation is punctuated by moments of discovery—moments when something new and important is suddenly discovered. Yet, future innovation won’t be about continuous, new iterations of products, but instead it will be about finding new ways to make people value and want the products. A better understanding of what people value, how they behave and how they make decisions could generate just as much economic value.
Success with smart products will require integrating the explosion of product data into the monolithic business model that functions today. This will be an era of man to the power of machine: not man versus machine, but man and machine. Thriving in this digital era of promise and uncertainty means increasing the velocity of innovation, experimentation and collaboration. The main engine will not be new technology—it will be people.
---
What You Will Find In The Full Report
- Background
- Methodology
- Demographics including position, company size, business type, business ownership, location and PPAI member status
- Executive Summary
- Detailed results including information on technology budgets, asset-based technology spending, services, hardware, software, order process and data security
Why Read This Report
The 2018 PPAI Business Study, “Technology Report,” provides a high-level view of the current technology trends in the promotional products industry. The metrics and benchmarks identified can be used as a practical guide to help business leaders at both supplier and distributor companies to:
1 Understand technology priorities
2 Identify relevant solutions and best practices
3 Benchmark operational IT spending levels
4 Maximize the strategic value of IT investments
5 Evaluate key performance indicators by comparing IT intensity and infrastructure metrics with peers.
Find the complete results from the 2018 PPAI Business Study and more exclusive PPAI Research by visiting www.ppai.org/research.
---
ROBYN’s Big Red Button
The Big Red Button (BRB) marks Oklahoma City-based distributor ROBYN’s entry into the smart devices scene. When the BRB is pressed by the recipient, a process is triggered that immediately connects the user to the caller’s dedicated account executive. If the AE cannot be reached, then the call is distributed round-robin style to the sales team. If unanswered, the caller hears a message that a “Swag Expert” will respond soon.
“As distributors, we all try to add value to the products and campaigns that we sell,” says Eric Granata, ROBYN vice president of business development. “The connectivity found in our smart button provides the opportunity to collect data, gauge effectiveness and gives the recipient a reason to continually interact with our client’s brand.”
The Big Red Button does not require a wi-fi connection and is ready to use out of the box. Individual buttons or fleets can be programmed remotely to give it new abilities. He adds, “What makes this button different than others in our industry is how versatile it is.”
He cautions, however, that introducing products and services like this is not for every distributor. “Selling this solution is not as easy as slapping a logo on a product and shipping it. In addition to the development, considerations must be made for device management and end-user support. It’s a daunting project, but we think it will be worth the effort.”
---
Moumita Das is research manager at PPAI.