
The Big Industry Picture

U.S. advertising and marketing revenues increased 3.2 percent in 2017 to $470.52 billion, as slower growth in traditional media due to the lack of major political and sporting events was offset by stronger growth in digital and alternative media, according to PQ Media (www.pqmedia.com). Digital media growth was fueled mainly by mobile channels, such as smart technology, videogames and social media, accentuated by expanding non-traditional media like influencer marketing, content marketing and branded entertainment.
Key growth drivers included brand marketers leveraging non-traditional channels to connect with younger demographics, including sponsorships of sports stars and online video celebrities, the use of product placements in original programs streamed on over-the-top video services, and positioning of mobile beacons and proximity services at retail and hospitality venues. Meanwhile, business-to-business marketers cultivated industry opinion leaders to drive mobile, social and online media conversations via influencer and content marketing tactics, such as word-of-mouth campaigns and sponsored webinars, according to PQ Media’s Global Advertising & Marketing Revenue Forecast 2017- 21.
Breaking down U.S. media revenues, the marketing sector grew five percent to $285.51 billion, but advertising media increased only 0.5 percent to $185.01 billion. Television revenue was the largest of the 13 advertising and marketing silos tracked by PQ Media in 2017 (see Table 1), reaching $93.80 billion, while entertainment media grew the fastest, surging 24.5 percent. It was also a strong year for promotional products, which ranked sixth in size and fifth in growth, rising 9.3 percent to $23.3 billion.
Top 10 Trends Driving Advertising And Marketing Growth In 2017
- Smart Technology
Brands increased spending on smart tech marketing over 600 percent in 2017, according to PQ Media, as more advertisers are relying on artificial intelligence (AI), augmented reality (AR), audio computer robots (BOTS), Internet of Things (IoT) and virtual reality (VR) technology to develop and distribute brand messages. Numerous marketers used smart tech in campaigns, such as Toyota’s partnership with IBM Watson to use AI to develop content for RAV4 television commercials. Expedia employed VR on digital sites for travelers to examine hotel rooms; McCormick partnered with MIT Media Lab to develop an IoT program to place recipes on refrigerator digital screens featuring McCormick spices; Burger King triggered Google Home’s audiobot with brand messages; and Whataburger parodied the AR game Pokémon Go with a screen shot on Facebook of the Pokémon trainer grabbing a meal near one of its restaurants. - 2016 Elections
Brands became more cognizant of consumer attitudes toward controversial issues, and as a result made moves such as pulling ads from cable news programs when negative reports arose surrounding the program hosts’ behavior. Other brand marketing tactics that arose from the 2016 election cycle included an increase in public relations campaigns to drive free earned media; a proactive effort to reach the “forgotten” voter (older, rural, disenfranchised consumers); and internal analysis of market research methodologies after pollsters were inaccurate in predicting the outcome of the 2016 presidential election. - Transparency
Agency/brand relationships became strained after it was revealed that agencies didn’t share discounts offered by media operators with their clients. Consequently, some brands such as Procter & Gamble reduced the number of agencies they use, while other brands like Unilever implemented a zero-based budgeting process. - Ad Tech
Programmatic media buying increased substantially in 2017, but it led to a backlash when, for example, ads were placed near controversial topics that resulted in more than a dozen brands, such as Walmart and Verizon, pulling their ads from YouTube. Meanwhile, other brands were dealing with ad fraud, estimated to drain one-third of all digital marketing spending due to billions of dollars lost to non-human traffic, infringed content and malverting-related activities. - Fake News
Facebook was affected by the proliferation of ad-supported fake news articles on its site, a significant number of which were allegedly distributed by various Russian organizations. Facebook and Google AdSense were forced to develop educational tools and technology to curb this practice. - Big Data
Despite all the obstacles digital media faced in 2017, its share of the overall brand marketing pie increased due to valuable demographic data that could be collected and downloaded. Traditional media companies, such as NBC Universal, developed their own programmatic tools to compete with digital. Concurrently, retailers were downloading large amounts of point- of- sales data, such as Walmart’s one billion data points per day, for analysis of consumer purchasing behaviors. - Net Privacy
Based on a recommendation by the new Federal Communications Commission (FCC) Chairman and supported by leading trade organizations such as the Association of National Advertisers, Congress passed a resolution in March 2017, which President Trump signed into law, to overturn the net privacy provision adopted by the FCC under the previous administration. The old rule forced internet services providers (ISPs) to ask permission from consumers to collect data on their digital behaviors, whereas the new resolution gives free rein to ISPs and brands to monitor searches, click-throughs and ecommerce. - Vertical Industries
Some brand categories enjoyed favorable outcomes in 2017, such as healthcare insurers and pharmaceutical companies increasing their ad budgets after efforts to repeal the Affordable Care Act failed three times. Meanwhile, the video game industry exhibited increased brand investments to sponsor e-sports competitions that iGENs (those born after 1996) and Millennials are increasingly attending and watching. - Retailers
More brick-and-mortar stores closed in 2017 than during the 2008-2009 recession, adversely affecting select brand marketing channels such as point-of-purchase, loyalty programs, coupons and trade promotions. Meanwhile, many malls were forced to close in smaller markets when anchor stores such as JC Penney were shuttered and the Real Estate Investment Trusts (REITs) that owned the malls could not meet debt obligations and declared bankruptcy. - Economy
Gross Domestic Product (GDP) continued to gradually improve throughout most of 2017, fueled by falling unemployment rates and increased manufacturing output, which led to higher consumer and business confidence indexes. With a higher demand for products, brands increased their marketing budgets.
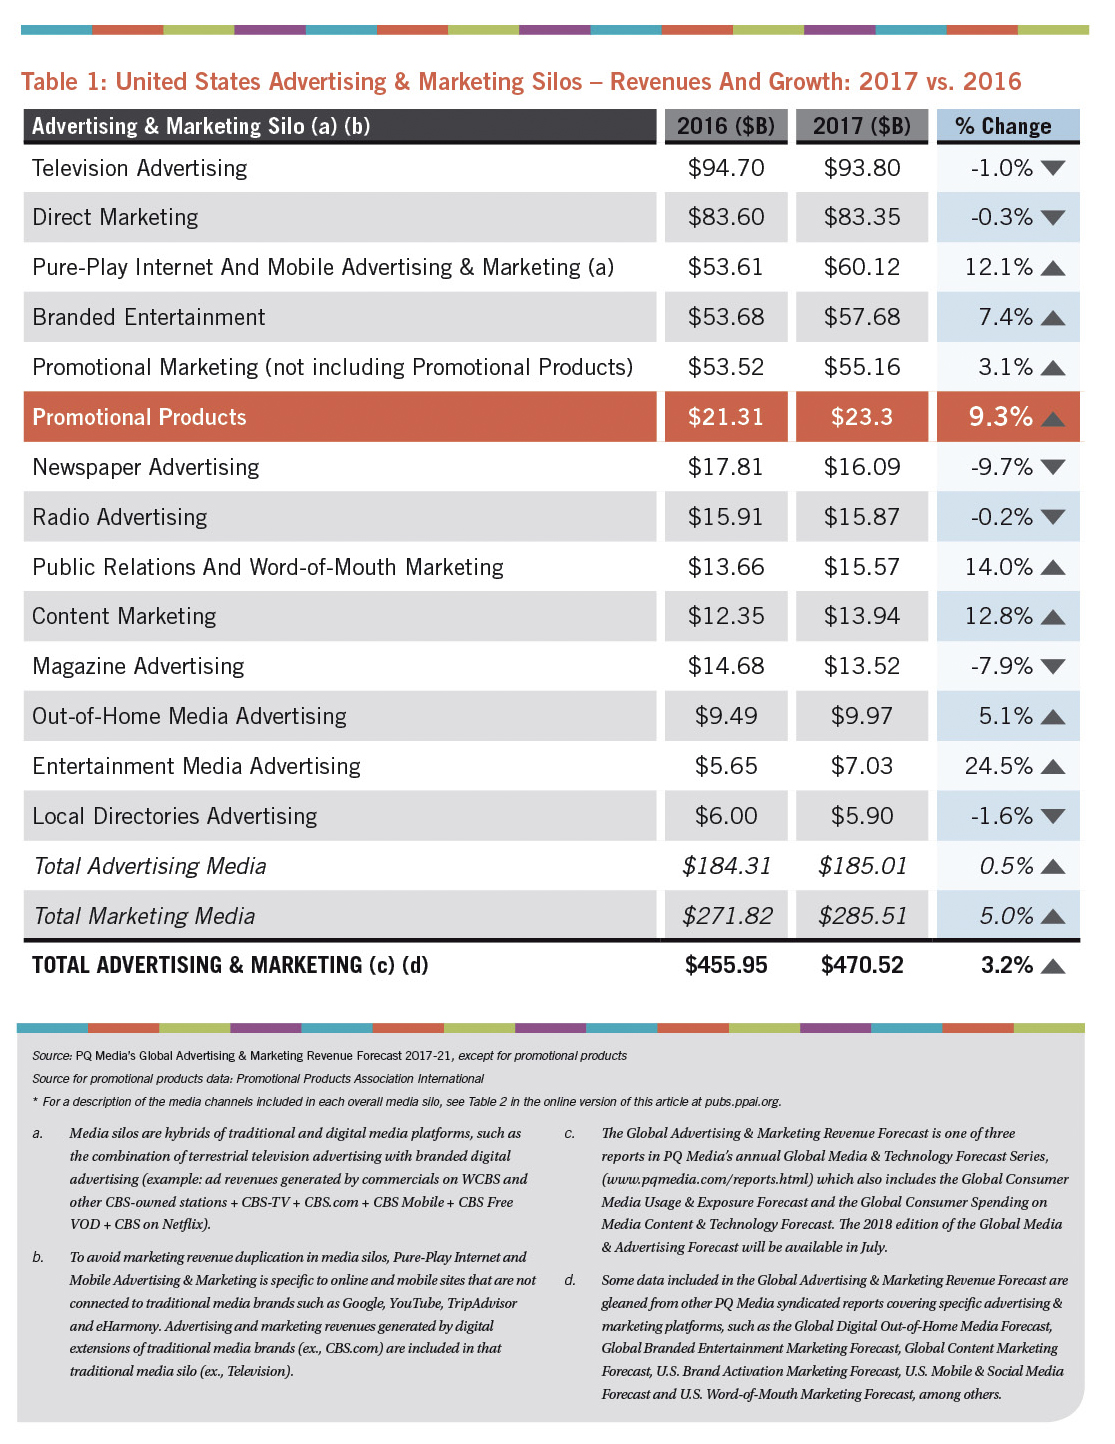
Table 2: Channels Included in Each Advertising & Marketing Silo
|
|
|
|
Television Advertising |
Broadcast TV Stations, Broadcast TV Networks, Broadcast Barter Syndication, Cable Networks, Local Pay TV Services (e.g., MSOs, Satellite TV, Telco TV), Regional Cable Sports, Digital Television Websites, Free Video-on-Demand, Interactive Television, Over-the-Top Video (ex., DVR Services like TiVo, Ads in Programming from Streaming Service like Netflix) |
|
Direct Marketing |
Direct Mail, Catalogs, Direct Response Television, Direct Response Radio, List Management (E-Mail Marketing is included in Pure-Play Internet & Mobile Media) |
|
Pure-Play Internet & Mobile Advertising & Marketing |
Internet & Mobile Advertising includes Digital Displays & Classifieds, Digital Video, Audio & Rich Media, Social Media, SMS & MMS Texting; Internet & Mobile Marketing includes Digital Search, E-Mail Marketing, Mobile Apps, Mobile Proximity Services, Smart Technology Marketing (e.g., AI, AR, BOT, IoT, VR) |
|
Branded Entertainment Marketing |
Experiential Marketing, including Event Sponsorships, Consumer Events, Live & Virtual B2B Events; Product Placement in TV, Film, Videogames, Digital Media, Music, and Radio & Print Media |
|
Promotional Marketing |
Consumer Promotions, including Point-of-Purchase, Coupons & Rebates, Premiums, Brand Licensing, Product Sampling, Loyalty Programs, Games, Contests & Sweepstakes; B2B Promotions, including Incentives Marketing, Trade Show Promotions (Promotional Products would be included here) |
|
Promotional Products |
See Promotional Marketing |
|
Newspaper Advertising |
Print Daily Newspapers, Print Weekly & Alternative Newspapers, Digital Newspaper Websites (Free Standing Inserts, Shoppers and Traders not included here, but in Coupons in Promotional Marketing) |
|
Radio Advertising |
Radio Stations, Radio Networks & Syndicators, Satellite Radio, Digital Radio Websites |
|
Public Relations & Word-of-Mouth Marketing |
Traditional Public Relations (ex., Press Releases, Crisis, Lobbying, Community Outreach), Word-of-Mouth Agencies (ex., Brand Ambassadors, Controlling Online Conversation) |
|
Content Marketing |
Hybrid Print & Digital Content Marketing (ex., Custom Magazines), Digital-Only Content Marketing (e.g., Branded Webinars), Non-Textual Content Marketing (ex., Sponsored Videos) |
|
Magazine Advertising |
Print Consumer Magazines, Digital Consumer Magazine Websites, Print Business-to-Business Magazines, Digital Business-to-Business Magazine Websites (Custom Magazines included in Hybrid Print & Digital Content Marketing) |
|
Out-of-Home Media Advertising |
Traditional Out-of-Home Media, Digital Out-of-Home Media, Ambient Out-of-Home Media (ex., brand messages on objects like back of movie tickets) |
|
Entertainment Media Advertising |
Console Videogames, PC Videogames, Online Games, Mobile Games, Digital Music Websites, Digital Film Websites, Streaming Services (In-Program Ads not included here, but in Television), Promotions in Home Videos, Digital Book Websites |
|
Local Directories Advertising |
Print Yellow Pages, Digital Yellow Pages, Digital Local Search Websites (ex., nycparking.com). Digital National Search with Local Functionality (ex., Google Local, UrbanSpoon, TripAdvisor) included in Pure Play Internet & Mobile Media |
|
TOTAL ADVERTISING MEDIA |
Television, Select Internet & Mobile Media, Newspapers, Radio, Magazines, Out-of-Home, Entertainment Media, Local Directories |
|
TOTAL MARKETING MEDIA |
Direct Marketing, Select Internet & Mobile Media, Branded Entertainment, Promotional Marketing, PR & Word of Mouth, Content Marketing |
U.S. Media Silo Trends (listed in order of size)
Television Advertising
Television historically has fluctuating ad growth rates, rising in even years with the influx of political campaign spending and international sporting events such as the Olympics and World Cup. In odd years, growth decelerates or declines, as it did in 2017 when it fell one percent to $93.80 billion.
Organic growth, when politics and sports are excluded, has been flat-to-declining over the past decade.
Some brands still advertise on TV because it reaches the largest audience, such as during the Super Bowl. Other brands have shifted to alternative brand marketing platforms such as mobile advertising and experiential marketing, due to falling ratings. Additionally, cord cutting among younger demographics has been a concern as they switch to subscriber-based over-the-top (OTT) video services such as Netflix, which offer original scripted programming without ads.
Direct Marketing
This media silo has begun to exhibit growth trends similar to TV, rising in even years due to increased political campaign spending on direct mail and telemarketing, and declining in odd years, such as in 2017 when it dipped 0.3 percent to $83.35 billion. In the past, declines were often associated with postage rate hikes, which affected the direct mail and catalog sectors, but with budgets shifting to e-mail marketing, and with most catalogs now available online, the decline has not been as steep when the postal service raises rates. Among channels that exhibited growth last year were direct response TV, driven by a resurgence in infomercials, and list management, which aggregated more data on consumers than ever before and was bolstered after Congress overturned net privacy, as noted above.
Pure-Play Internet And Mobile Advertising & Marketing
Although pure-play internet and mobile media registered a 12.1 percent increase in 2017 to $60.12 billion, the two media platforms have growth projections moving in opposite directions. Mobile advertising and marketing grew at high double-digit rates in 2017 exceeding 20 percent, driven by smart tech marketing, mobile video advertising and mobile search marketing. Meanwhile, numerous internet categories registered declines in 2017, particularly online search, as most consumers are now using mobile devices for search. It should be noted that if pure-play internet and mobile media were combined with digital brand extensions of traditional media operators, total digital advertising and marketing grew approximately 13 percent in 2017 to slightly more than $100 billion.
Branded Entertainment Marketing
Experiential marketing took on more importance in 2017 as brands sought to engage one-on-one with consumers and clients at events and trade shows, fueling a 7.4 percent increase in branded entertainment to $57.48 billion. Meanwhile, product placement rose at double-digit rates for the sixth consecutive year, as brands worked more closely with producers to integrate products into plot lines of favorite television programs and films, such
as Procter & Gamble products being highlighted in an episode of Blackish.
Promotional Marketing (not including promotional products)
The improving economy helped drive growth in select promotional marketing channels, leading to a 3.1 percent gain in 2017 to $55.16 billion.
Business-to-business promotions rose at a faster rate than consumer promotions in 2017, with incentives marketing and trade-show promotions both growing at accelerated rates for the year.
Meanwhile, most consumer promotions channels declined in 2017 due to the adverse retail climate described in the trends analysis, with store closures impacting point-of-purchase displays, premiums and product sampling, while coupon redemption historically drops as the economy improves. The exceptions were brand licensing, which saw an uptick associated with 3-D printing of lifelike figurines and products associated with the latest Star Wars film; and loyalty programs, which are increasingly becoming available via mobile wallets, as well as a rise in hospitality program points (hotels, for example) due to the increase in business travel as the economy improved.
Promotional Products
As reported last month in PPB, promotional products revenues rose 9.3 percent in 2017 to $23.3 billion.
Double-digit growth in the fourth quarter and strong online sales spurred growth during the year, as well as product sales from non-industry providers.
A downturn is expected in 2018, regardless of the influx of orders by political candidates, who are expected to emulate 2016 trends, when promotion products spending by political campaigns was the highest ever, and the products were used to drive traffic to campaign websites (ex., Bernie’s Briefs) to increase donations and/or generate additional revenues for candidates’ campaign.
Newspaper Advertising
Online newspaper subscriptions increased slightly in 2017, in part due to protests by liberals of the Trump Administration’s attacks on several leading news outlets, claiming that they’re purveyors of “fake news.” However, the protest movement didn’t translate into more brand spending on newspaper advertising, which fell 9.7 percent to $16.09 billion in 2017. Daily and Sunday newspaper advertising dropped at double-digit rates, as classifieds were rarely used for employment, auto or real estate, and the distressed retail market led to fewer stores touting sales during select holidays. Weekly newspaper advertising declined at low single-digits, as they were more immune to retailers shifting to digital advertising because of the relatively few local online directory sites operating in small towns that weeklies tend to serve.
Radio Advertising
Radio growth has been nearly flat for the past five years, with slight upticks in even years due to the influx of political advertising, and down slightly in odd years, such as the 0.2 percent dip posted in 2017 to $15.87 billion. Radio listenership remains steady, regardless of new automobiles being equipped to handle smartphones and MP3 players.
Despite a drop in overall new car sales in 2017, the first decline in four years, satellite radio ad revenues rose at a double-digit rate due to a higher commitment to add sales personnel.
Digital radio ad growth decelerated, with firms like Pandora finding it difficult to retain subscribers due to an overabundance of ads.
Public Relations And Word-of-Mouth Marketing
More businesses turned to public relations in 2017 to drive free earned media, resulting in a 14 percent increase to $15.57 billion. Crisis communications also became more vital during the year to deal with growing viral attacks on people and companies associated with controversial issues.
For word-of-mouth marketing, the term “influencer marketing” became an important concept for brands, as they sought to reach key opinion leaders that would drive the online and offline conversations about their products, such as affluent couples who host dinner parties and promote select wines via their blogs.
Content Marketing
With many traditional media platforms posting revenue declines, broadcast operators and print publishers more readily accepted third-party news articles in 2017, some of which were content marketing pieces sponsored by brands, which fueled 12.8 percent growth in this media silo to $13.94 billion in 2017. Print custom publications had a resurgence in 2017, such as Airbnb launching its first print magazine. Marketers increased spending on branded online videos through YouTube, particularly on live feeds featuring select products. There was also a marked increase in branded webinars aimed at consumers, rather than business-to-business users.
Magazine Advertising
Despite efforts by the magazine industry to promote its digital brand extensions, overall magazine advertising declined 7.9 percent in 2017 to $13.52 billion.
Business-to-business magazines didn’t drop as deeply as consumer magazines, as B2B publishers offered up new services such as sponsored database listings on their digital sites, and construction magazines listing electricians, masons and others in local markets.
Consumer magazines continued to exhibit double-digit declines in single-copy sales, driven down primarily by general-interest titles and the shuttering of retail outlets that carried their magazines.
Out-of-Home Advertising
Brands find out-of-home advertising attractive for several reasons, including its aversion to ad-skipping technology, which helped drive up revenues 5.1 percent in 2017 to $9.97 billion. Digital out-of-home (DOOH) media is fueling overall growth, particularly digital billboards in transit locations and place-based video networks in doctors' offices. DOOH ad buyers have moved to make media buying easier by implementing programmatic buying technology in recent years, making this media silo among the most proactive in developing ad modules for smart cities being developed nationwide, such as the conversion of old phone booths into ad-supported charging stations and wi-fi locations in New York City.
Entertainment Media Advertising
While entertainment media recorded the fastest growth of the 13 media silos tracked here, rising 24.5 percent to $7.03 billion in 2017, this growth rate represents a deceleration from prior years due to a slower single-digit increase in console videogame advertising, the largest channel within this category. Fewer new videogame titles were released last year compared with 2016 for PlayStation and Xbox, while many Nintendo Switch titles were aimed at younger audiences that brands often avoid targeting as a result of consumer pressures. Gains in this segment were driven by mobile game ads and recorded music subscription services such as Spotify.
Local Directory Advertising
For many years, local directory advertising growth plunged at double-digit rates as use of print phone books declined significantly, forcing many directories to shutter. However, online directory advertising has grown larger than print directories, so the continued print decline didn’t impact overall revenues as substantially, resulting in a 1.6 percent overall decline to $5.90 billion in 2017.
Note: PQ Media is the source of all 2017 size and growth data cited in this article, except PPAI data used for promotional products.
---
Patrick Quinn is president and CMO and Leo Kivijarv, PhD, is EVP and research director of PQ Media. The firm, based in Stamford, Connecticut, is a leading provider of global media econometrics and a pioneer in emerging media research. Its industry-leading predictive econometrics system serves executives charged with advancing strategic initiatives in the rapidly changing media, entertainment and communications industries. www.pqmedia.com