Strength In Numbers: 2018 Distributor Sales Volume Estimate

Small but mighty. That’s one way to look at the power small distributors had on sales in 2018. Their sales were enough to recalibrate the balance between small and large distributors to capture more of the total industry sales volume.
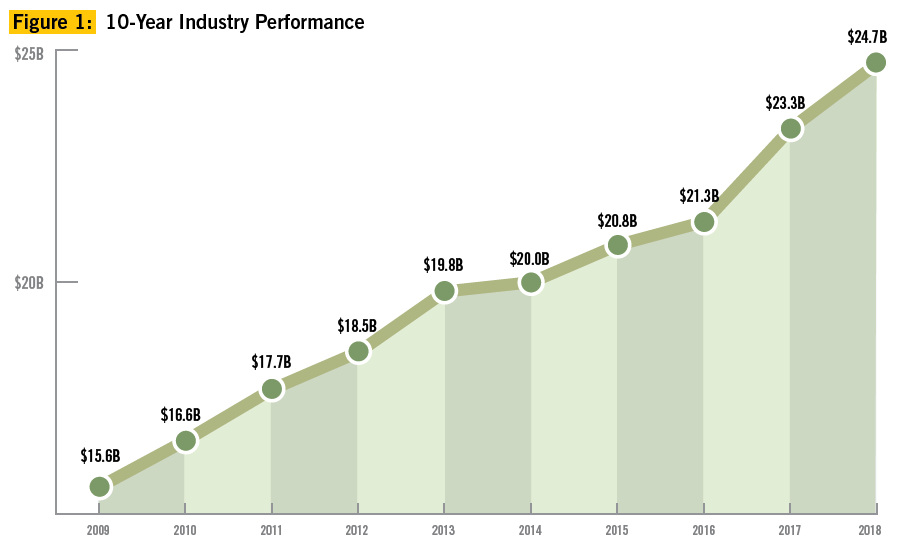
Overall, distributors’ sales volume increased by 6.27 percent to a record $24.7 billion, according to PPAI’s 2018 Sales Volume Study, an annual estimate of U.S. distributor promotional products sales. The growth was driven mainly by sales from small distributors (those with sales less than $2.5 million) and they experienced a 12.27 percent increase over 2017, while larger companies saw only a 1.92 percent rise in sales.
Not only did sales grow for small companies but the count of these companies was up as well. In 2018, survey participants with sales revenue under $2.5 million increased to 23,400 from 22,721 in 2017. This may be due to the expanded list of companies invited to participate in this year’s survey; the list reflected the industry’s evolution as more small printing and graphic design companies enter the promotional product space. In contrast, the number of large companies reporting sales over $2.5 million remained relatively unchanged (840 vs. 843 in 2017). The total number of U.S. distributor companies estimated was 24,240 compared to 23,564 in 2017.
For more than 50 years, PPAI has been collecting, analyzing and reporting distributor sales, and this study is considered the most definitive and comprehensive of its kind in the industry. With few exceptions (largely in the aftermath of the 9/11 economic downturn in 2002 and the global recession beginning in fall 2008), this annual estimate of U.S. distributor promotional products sales has shown a general increase in business over the years and has even eclipsed growth rates by some mass media advertising and promotion alternatives. As a result, the survey has become an important element in revealing the changing face of the promotional products industry from year to year.
Key Findings
Overall, more companies (63 percent) reported increased sales compared to 2017 (60 percent), while fewer saw declining sales (18.8 percent vs. 21.1 percent in 2017). Compared to 2017, significantly more large distributors reported increased sales in 2018 (81 percent vs. 71 percent in 2017). The number of smaller distributors with increased sales remained relatively unchanged (60 percent in 2018 vs. 59 percent in 2017), but the average total sales volume was significantly larger due to increased volume across all distributor categories.
Small distributors with sales between $1 million and $2.5 million experienced the highest growth (27.3 percent), followed by those with sales between $250,000 and $500,000 (4.2 percent). Distributors with sales up to $250,000 and those selling between $500,000 and $1 million experienced a more modest growth (+1.8 percent and +2.2 percent, respectively). The increase across all the categories averaged to a total growth of 12.27 percent for the small-distributor segment.
Comparisons By Company Size
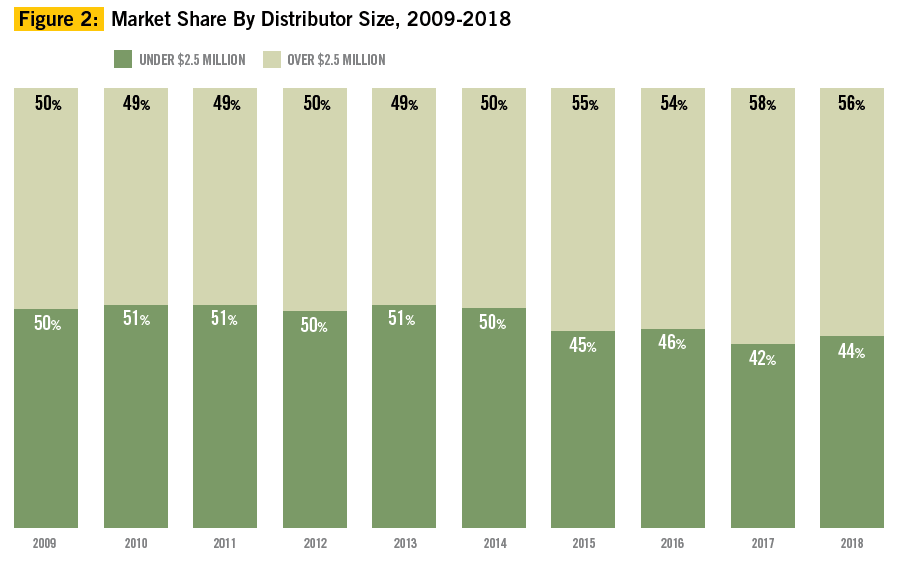
In terms of market share, the 840 firms representing large companies (over $2.5 million in sales revenue) captured $13.7 billion of the business—a 55.57 percent share. It should be noted that the large-company segment included franchisors like AIA Corporation, Proforma and HALO Branded Solutions that report for their franchisees. Sales from smaller distributors as a group amounted to $11 billion or 44.43 percent market share. See Figure 2.
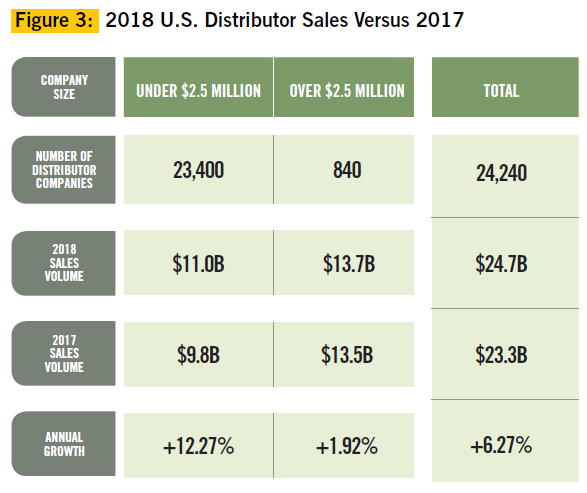
In 2018, small distributors grew at a higher rate (+12.27 percent), coming back from almost negligible growth (+0.89 percent) in 2017, while for large distributors the average growth slowed. Distributors in the $2.5 million-plus bracket show a gain of +1.92 percent over 2017. See Figure 3.
Note that for the 2018 survey, the universe of companies invited to participate in the survey was broadened to include more businesses (e.g. printing, graphic design) that are expanding their services to include promotional products distribution as the industry evolves. This directly impacts the estimation of the total number of small distributors reported and total sales volume for this segment.
The average revenue for the 23,400 firms in the small-company segment was $469,833 (compared to $430,912 in 2017), while the median—that is, the midpoint where half the population is above and half is below—was $130,150, compared to $150,000 in 2017.
Sales By Company Size
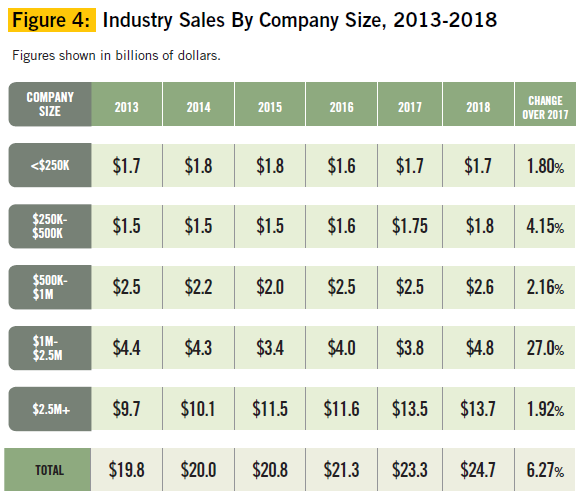
All small company categories saw an increase in sales in 2018. The most notable growth was found among companies in the $1 million to $2.5 million segment with a 27.3 percent increase in sales. See Figure 4.
Retail Branded Product Sales
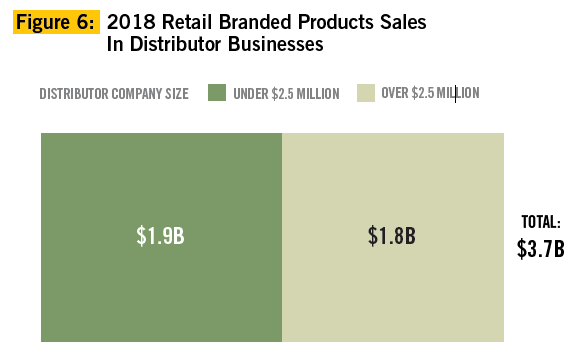
For the first time in this study, PPAI asked about retail branded products—those defined as consumer-facing, brand-name products that add a sense of distinction to incentive and recognition programs as well as individual end-user gifts. Examples include: Yeti; Maui Jim, Inc.; TUMI; Nikon, Inc.; and many more. According to study results, sales of retail-branded products are estimated to be $3.7 billion, or 14.8 percent of the industry total sales.
Among large distributors, nearly 96 percent sold retail branded promotional products, while 79 percent of small distributors did so in 2018. However, the proportion of the sales volume in this category out of the total sales for the small distributor segment was larger. See Figure 6.
Online Business
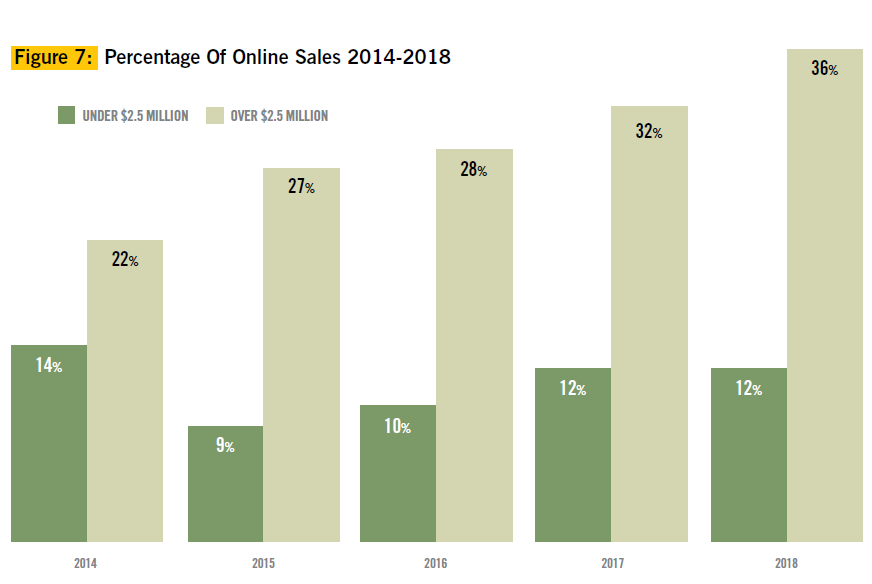
Online sales are defined as buys resulting from orders placed through an online store or website. Web sales in 2018 (not to be confused with salespeople transmitting orders online) are estimated to be $6.3 billion or 25.3 percent of industry total sales, up from 23.2 percent in 2017. See Figure 7.
Orders Placed With Non-Industry Suppliers
On average, business with non-industry suppliers, companies not listed with PPAI, SAGE or ASI, continued to increase. However, it slowed among large distributors, who reported doing 16.51 percent of their business with non-industry suppliers in 2018 compared to 16.05 percent in 2017.
On the other hand, small distributors reported doing 13.45 percent of their business with outside suppliers in 2018, a more notable increase from 12.50 percent in 2017. See Figure 8.
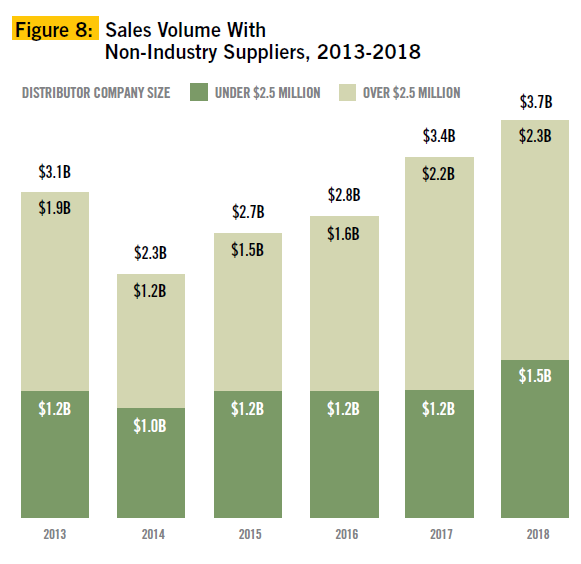
Collectively, distributors of all sizes sold $3.7 billion in products from non-industry providers in 2018—or 15.14 percent of the total dollar volume. Overall, sales from non-industry providers increased by 10.6 percent over 2017.
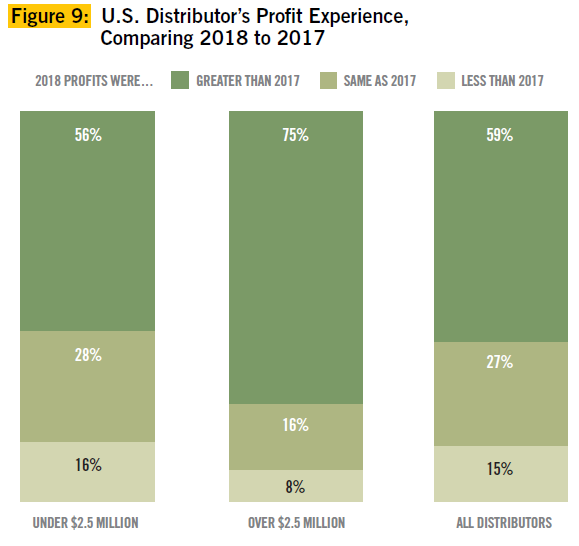
The Profit Picture
On average, the number of distributors reporting profit growth in 2018 increased slightly over 2017. Nearly six in 10 (59 percent) distributors had greater profits over the prior year (56 percent). Large distributors gained the most, with 75 percent reporting higher profits compared to 68 percent in 2017. The increase in the number of small distributors with profit gains was modest (56 percent) compared to 2017 (54 percent). See Figure 9.
Products, Programs, Industries: Trends In 2018
The promotional products category of wearables (including apparel and fashion accessories) retained its No. 1 spot at the top of the list of best-sellers, where it has reigned for decades. The rest of the top five best-selling product categories follow in this order: drinkware, travel (including bags and wallets), writing and technology products. There was just a slight shift from the 2017 study with writing and travel products switching places. Among types of programs involving promotional products, brand awareness moved up one rank from 2017 and came in first, followed by business gifts, trade shows, employee recognition and distribution services. The top industries buying promotional products changed slightly from the 2017 data but the top five remained the same. In the lead again are business services, followed by health care, which climbed from fifth place in 2017, education, financial and manufacturing.
 Get The Full Report
More detailed findings, including products, programs and industry categories by percentage of annual sales, can be viewed in the full report available free to PPAI members and for purchase by companies not eligible for membership. Log in to access the full report at www.ppai.org/members/research or email membership@ppai.org to join. For questions on this report, email PPAI Research Manager Mo Das at MoD@ppai.org.
How The Study Was Conducted
PPAI’s study is based on actual sales reported by U.S. promotional consultant companies, and again this year it was conducted by Relevant Insights, LLC, an independent market research agency, on behalf of PPAI. The survey was distributed both via email and mail to more than 29,000 distributors, including PPAI member and nonmember distributor companies. As in the past, the sample was drawn from a merge/purge of several separate industry databases, including PPAI and UPIC (Universal Promotional Identification Code) lists.
Companies had the option to answer the survey online or return it by mail. The top 50 distributors were also reached by phone to ensure their information was included in the analysis since omission of any distributor with a large volume of business could distort the statistics. A census of all distributors doing $2.5 million or more in sales was also included. Combining the samples from the different data collection methods used resulted in a total of 24,240 distributor surveys covering the entire U.S. industry.
––––––––––––––––––––––––––––––––––––––––––––––––––––––––––––––––––––––
Michaela Mora is principal of Relevant Insights, LLC.
––––––––––––––––––––––––––––––––––––––––––––––––––––––––––––––––––––––
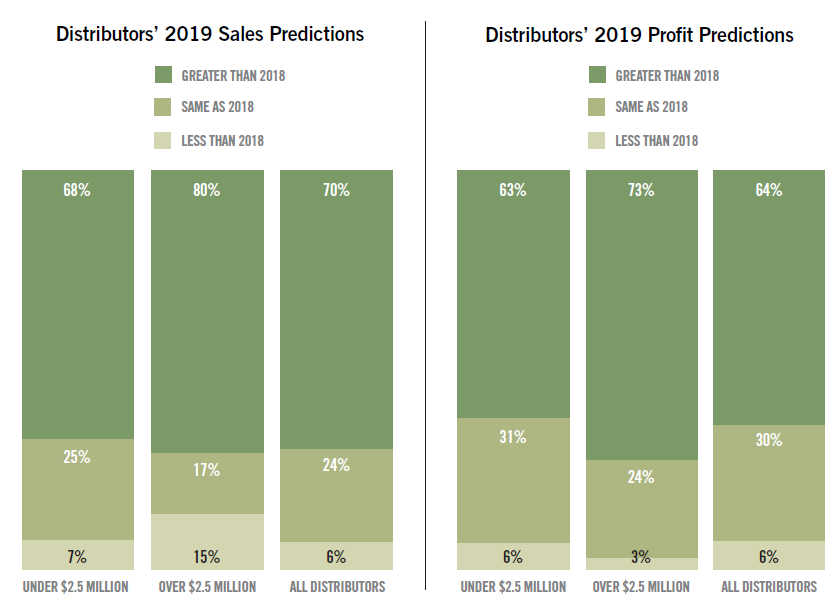
About seven in 10 distributors who participated in PPAI’s Sales Volume Study say they are optimistic about sales and profits for 2019, especially among large distributors. The reasons are varied but more than a quarter of companies (26 percent) that expect greater profits this year base their predictions on new business development. Other factors cited as reasons to be optimistic about 2019 are year-to-date sales (18 percent), advertising and marketing efforts (13 percent), experience and company history (10 percent), the economy, market trends and local economy (eight percent) and an increased sales force (seven percent). Four percent indicated the following reasons to expect a profit increase: changes in pricing strategy or better margins, improvements in business practices, returning clients/increased sales from existing clients and expansion to other market segments and product categories.
In late March, PPB checked in with 10 distributor companies for their insights on year-end expectations and the results they are seeing so far.
––––––––––––––––––––––––––––––––––––––––––––––––––––––––––––––––––––––


Kyle Gibson
Founder & CEO
KG Specialties
Portland, Oregon
PPAI 270537
Company Founded: 1992
Key Markets Served: Banking, construction, health care, restaurants
Types of Services Offered: In-house screen printing and embroidery, and promotional products
How is your business faring so far in terms of meeting 2019 goals? To date we are -0.89 percent [in our] P&L year-to-date comparison, which is actually great as we lost a half-million-dollar client in Q2 of last year. So, we are doing great in those terms.
Where do you see your company by year-end and how does that compare to 2018? I believe we will be at $3.4 million—up from $3.2 million in 2018.
What trends or issues are having the biggest impact on your business and why? Clients are asking for more brand-name products and that has been a big revenue generator for us.
––––––––––––––––––––––––––––––––––––––––––––––––––––––––––––––––––––––
 Teresa Moisant, MAS
Owner
Moisant Promotional Products
Oklahoma City, Oklahoma
PPAI 107015
Company Founded: 1990
Key Markets Served: Hospitals, credit unions, banks, universities, schools, nonprofits
Types of Services Offered: Full-service promotional products company
How is your business faring so far in terms of meeting 2019 goals? Our sales are equating last year’s sales in the first quarter.
Where do you see your company by year-end and how does that compare to 2018? We feel like we will be able to report a five-percent increase over 2018. Last year’s sales surged in the fourth quarter; customers had money they needed to spend.
What trends or issues are having the biggest impact on your business and why? The biggest trend we are seeing is that several accounts have been purchased or acquired by accounts out of our market area. Those accounts are now controlling all marketing out of the corporate office. We are also seeing our education accounts and nonprofits operating with a tighter budget. It just means we have to work a little harder and find new accounts.
––––––––––––––––––––––––––––––––––––––––––––––––––––––––––––––––––––––

Jim Franklyn
VP Business Development
Swag Promo
Atlanta, Georgia
PPAI 562712
Company Founded: 2012
Key Markets Served: Automotive industry, staffing, construction, real estate, health care and nonprofits on a national level
Types of Services Offered: Swag Promo is a turnkey hybrid solution for on-demand ordering. Its mission is to become the Amazon of the promotional products industry specializing in the execution of promotional product programs, online stores, fulfillment, kitting, printing and to own its own freight company. Its parent company has distribution centers in Las Vegas, Nevada; Chicago, Illinois; Washington D.C.; and two facilities in Atlanta, Georgia.
How is your business faring so far in terms of meeting 2019 goals? Year to date we are where we expected to be through the first few months.
Where do you see your company by year-end and how does that compare to 2018? In 2018 we grew 60 percent, and our projections for 2019 are for growth of more than 40 percent.
What trends or issues are having the biggest impact on your business and why? Speed kills. Our industry has spoiled customers to the point where they expect everything to happen fast. Explosive internet growth, B2C internet players penetrating our space, the Amazon effect and shipping costs are all impacting the way we do business. Add in the emerging buying power of Millennials, the departure of Baby Boomers, industry consolidation and aggressive importing options with lower minimums and faster lead times, and the net result is that your business model better be fast, efficient and equipped to be an online provider that has the resources to leverage relationships. We have also seen some caution with the uncertainty surrounding tariffs.
––––––––––––––––––––––––––––––––––––––––––––––––––––––––––––––––––––––

 Matina Zenios
President & Owner
Artina Promotional Products
Powell, Ohio
PPAI 107335
Company Founded: 1967
Key Markets Served: Associations, building supply distributors, education, health care, manufacturing and professional services
Types of Services Offered: Awards, employee recognition, promotional products, graphic design services, online company stores and fulfillment
How is your business faring so far in terms of meeting 2019 goals? On target.
Where do you see your company by year-end and how does that compare to 2018? We anticipate being up at the end of the year by 10 percent.
What trends or issues are having the biggest impact on your business and why? We are seeing a slightly reduced average order size.
––––––––––––––––––––––––––––––––––––––––––––––––––––––––––––––––––––––
 Tad Webster
President/COO
BrandInc
London; Hong Kong; Sydney, Australia; Singapore; Los Angeles, California; Toronto, Ontario
PPAI 602113
Company Founded: 1998
Key Markets Served: Automotive, construction, health care, hospitality, nonprofit and technology
Types of Services Offered: BrandInc is an independent, award-winning merchandising agency offering global solutions with in-house design and product development, sourcing and production, integrated ecommerce solutions using cutting-edge technology and customer service. It designs and produces retail-quality, custom-branded merchandise from its global footprint of offices.
How is your business faring so far in terms of meeting 2019 goals? We are three percent ahead of our budgeted goal increase of 15 percent over 2018.
Where do you see your company by year-end and how does that compare to 2018? We are excited to be at an 18-percent increase in sales over 2018 and we envision this percent of sales increase to continue through the end of 2019.
What trends or issues are having the biggest impact on your business and why? Our clientele is focused on the latest and greatest tech merchandise currently offered in the industry. In addition, many larger, global clients are requesting a turn-key global solution for their online and merchandising needs. We can provide quality merchandise that is custom designed, manufactured and distributed globally with the same quality and branding requirements. And with our global office and staff, we can support the larger, global clients who have these initiatives.
––––––––––––––––––––––––––––––––––––––––––––––––––––––––––––––––––––––

Andrea Kramer
President
City Apparel
Findlay, Ohio
PPAI 242048
Company Founded: 2001
Key Markets Served: City Apparel provides solutions to clients throughout the U.S. and Canada; the largest industries/markets are manufacturing, universities and health care.
Types of Services Offered: Uniforms, promotional products, corporate apparel, design and decoration, printed material, signage, incentives, company stores, event packaging, fulfillment, corporate identity programs and national distribution
How is your business faring so far in terms of meeting 2019 goals? The first quarter for both revenue and profitability is typically a struggle every year; however, as of today our organization is up 45 percent in revenue and is more profitable than we have ever been. We launched a new enterprise-resource planning system six months ago and continue to find efficiencies and other cost-saving measures, which have contributed to our profitability in the first quarter.
Where do you see your company by year-end and how does that compare to 2018? City Apparel will have a banner year both with increased revenue from new program business (reoccurring revenue) that we have added and expect to close this year, and the ongoing drill down in finding efficiencies in selling, business operations and manufacturing in our business.
What trends or issues are having the biggest impact on your business and why? City Apparel does not expect there to be any major shake-ups in 2019 that will substantially affect our business. There will be the usual suspects in increased costs and workforce development, but we plan to run status quo to capture all aspects of our increased revenue and cost-saving measures. We do see a shake-up in the economy in 2020 and are focusing on industries that are not typically impacted. In fact, we are being mindful of the customers we bring on and are laser-focused on specific prospects for 2019.
––––––––––––––––––––––––––––––––––––––––––––––––––––––––––––––––––––––

 Phil Koosed
President
BAMKO
Los Angeles, California
PPAI 242148
Company Founded: 2000
Key Markets Served: Technology, franchise business, entertainment, fitness, QSR/restaurants, spirits and theme parks
Types of Services Offered: Branded merchandise, custom technology solutions, retail merchandise and multi-channel marketing campaigns
How is your business faring so far in terms of meeting 2019 goals? We cannot discuss specifics on financial performance because we are a publicly traded company. However, I am quite pleased with the year we’ve had to date, particularly in our ability to land some high-profile programs and the performance of some of our newest sales reps, who are really starting to hit their stride.
Where do you see your company by year-end and how does that compare to 2018? I have very high expectations for 2019. We are in a serious growth mode right now with new programs, technologies and sales reps all coming online. Thank goodness we’ve invested so heavily in the infrastructure over the last few years.
What trends or issues are having the biggest impact on your business and why? We have had a number of new sales reps join our company in the past year. We are seeing more and more talented sales reps looking for a new home because of their need for greater capabilities in technology, creative and sales support. We have invested heavily in those areas and are proving to be a great fit for folks who have the ability but need a better team around them. As private equity takes its toll on the long-term growth and investment of some of our competitors, our willingness to invest in long-term growth and a wealth of capabilities is having a massive impact on making our sales reps more successful here than they would be elsewhere.
––––––––––––––––––––––––––––––––––––––––––––––––––––––––––––––––––––––
 Jo-an Lantz, MAS
President/CEO
Geiger
Lewiston, Maine
PPAI 105182
Company Founded: 1878
Key Markets Served: Geiger serves a wide variety of clients and markets, in both B2B and B2I.
Types Of Services Offered: Full services, corporate programs, company stores, integrated custom customer websites, graphics, creative, global, fulfillment, custom kitting and packaging, site sales, pop-up stores, group buys and inventory
How is your business faring so far in terms of meeting 2019 goals? We have aggressive, double-digit goals in all three business channels, consultative sales, ecommerce and international. We are off to a strong start and on track to meet the goals in each channel.
Where do you see your company by year-end and how does that compare to 2018? We will continue to expand in the U.S. and globally and hit our sales targets.
What trends or issues are having the biggest impact on your business and why? The uncertainty of future tariffs and how [the issue] has impacted pricing from production partners has been an early issue this year.
––––––––––––––––––––––––––––––––––––––––––––––––––––––––––––––––––––––
 Justin Zavadil
President
American Solutions For Business
Glenwood, Minnesota
PPAI 101656
Year Founded: 1981
Key Markets Served: All
Types of Services Offered: Print, promotional products, office products, point-of-purchase fixtures and displays
How is your business faring so far in terms of meeting 2019 goals? We are currently up around 10 percent year over year.
Where do you see your company by year-end and how does that compare to 2018? We will have double-digit percentage sales growth that is about the same as last year. We will have started to implement an upgrade of our ecommerce and back-end processing systems. Our retail division, arX Display, will have one year under its belt with many national enterprise customers as clients.
What trends or issues are having the biggest impact on your business and why? We continue to see the demand of bigger and better technology offerings. We feel that our ecommerce system is the best in the industry and can handle the largest of clients. We developed it in-house and own the source code, so customizing the platform to the clients’ needs is easily done by our in-house team. This has enabled our sales associates to win more business with larger clients.
The other trend we see is the commoditization of our normal business. With much larger online retailers in our space, the need to diversify has become more and more evident. Our retail division, arX Display, has allowed us this diversification. We have a very seasoned and knowledgeable team that works directly with our sales associates to win display business with national retailers of all types. This is business in which these customers need expertise, engineering and design that cannot be ordered from Amazon or anywhere else online. We have the best salespeople in the world—we just need to give them things to sell where they can be profitable.
––––––––––––––––––––––––––––––––––––––––––––––––––––––––––––––––––––––
 Bret Bonnet
President
Quality Logo Products, Inc.
Aurora, Illinois
PPAI 304730
Year Founded: 2003
Key Markets Served: All
Types Of Services Offered: Promotional products and logo design
How is your business faring so far in terms of meeting 2019 goals? Fantastic! We’re really excited about the start to 2019; 2018 was a year filled with retooling and infrastructure changes, but we’re slowly, but surely, beginning to reap the benefits of 2019.
Where do you see your company by year-end and how does that compare to 2018? I think we’ll see growth in the eight percent range year to year. Profit/margin growth is expected to be in the 10 percent range year to year.
What trends or issues are having the biggest impact on your business and why? Two big challenges facing QLP these days are sales tax and the overall cost of doing business. Sales tax is a mess. We’ve got it handled but knowing how complex it is and the overhead required to manage it. I just don’t see how many distributors are going to be able to remain compliant and still actually run their businesses and sell.
Next, the cost of doing business is a constant battle. Changes in labor laws and tariffs top the list. Until we have people who understand these issues creating policy for us, these two issues are always going to be a constant battle—especially in Illinois.
––––––––––––––––––––––––––––––––––––––––––––––––––––––––––––––––––––––
Compiled by Tina Berres Filipski, editor of PPB.