
2017 A HUGE YEAR FOR PROMO SALES

Individually, many distributors knew their 2017 sales were strong, but collectively, the year was a powerhouse.
It’s been four years since the industry has seen the kind of sales increase experienced in 2017. Overall, significant growth among large distributors led the increase as this group captured nearly 58 percent of the industry’s total sales volume, according to PPAI’s 2017 Sales Volume Study, an annual estimate of U.S. distributor promotional products sales.
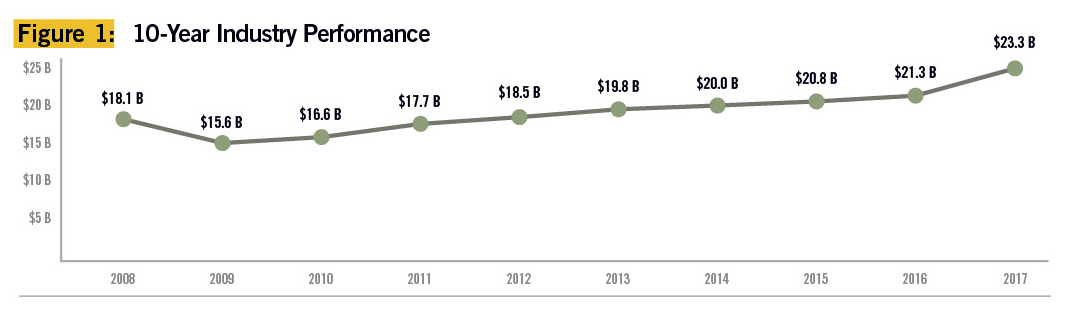
The results of the industry-wide survey show distributor sales volume rose by 9.3 percent in 2017 to a whopping $23.3 billion, with growth driven mainly by large distributors with annual sales over $2.5 million. Among this group, sales were up by 16.3 percent in 2017 over 2016, while smaller companies (those with sales under $2.5 million) saw only a 0.89 percent uptick.
Since 1965, PPAI has been measuring and analyzing the industry’s annual growth based on reported distributor sales. The 2017 sales volume increase is the highest since 2000, when industry sales grew by 19.5 percent. In 2016, sales were up by only 2.4 percent (see Figure 1).
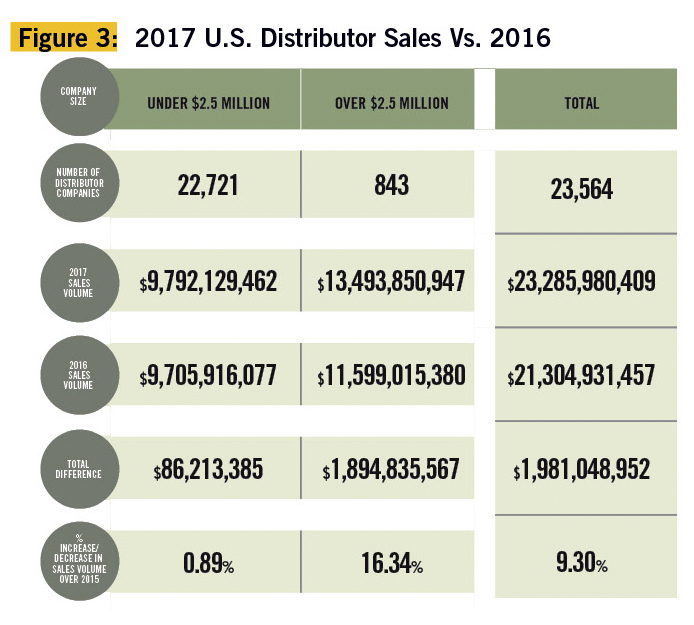
Although distributor sales were almost flat among small companies, the number of participants in that category increased to 22,721 from 21,577 in 2016. In contrast, the number of large companies reporting sales over $2.5 million declined slightly to 843, compared to 889 in 2016, and the total number of U.S. distributor companies increased to an estimated 23,564, up from 22,466 in 2016.
The lion’s share of the 2017 sales volume increase came from two significant trends: online sales and sales of products from non-industry providers (companies not listed with PPAI, ASI or SAGE).
Online sales of promotional products grew significantly in 2017, representing 23.2 percent of the year’s total sales volume compared to 19.8 percent in 2016. Total online sales grew by 28.1 percent to $5.3 billion, compared to $4.2 billion in 2016, and that trend is driven by a significant increase from both large (30.5 percent) and small (19.8 percent) distributors.
In addition, on average, almost $3.4 billion came from product sales from non-industry providers—14.6 percent of the total dollar volume. Overall, sales from non-industry providers increased by 20 percent over 2016.
One other item of note is the timing of this year’s study. The research was conducted slightly earlier than in previous years. Surveys were in the field by early February so that PPAI could publish results in the second quarter, giving members the data to benchmark their businesses earlier in the year.
Read on for highlights from the 2017 study, and view the full report with complete methodology and detailed findings (available to PPAI members only) at www.ppai.org/research.
Comparisons By Company Size
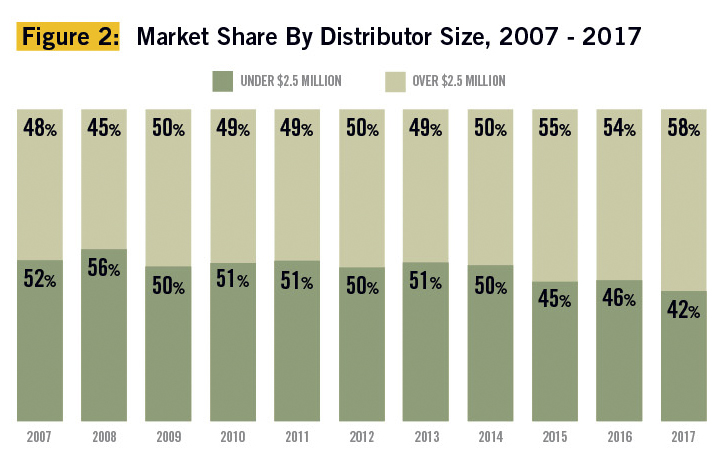
In terms of market share, the 843 distributor firms representing large companies (over $2.5 million) captured $13,493,850,947 of the business—a 57.95 percent share. This segment included franchisors such as AIA Corporation, Proforma and HALO Branded Solutions, and these firms report for their franchisees. As a group, sales from smaller distributors (revenues less than $2.5 million) amounted to $9,792,129,462, or 42.05 percent of the total.
Compared to the past 10 years of industry sales, the large distributors’ share of total sales volume saw the largest increase (see Figure 2).
In 2017, the growth pattern was reversed. Unlike in 2016 when small distributors experienced most of the growth, in 2017 they saw almost negligible positive growth, while large distributors achieved double-digit increases. Specifically, distributors in the $2.5 million-plus bracket recorded sales of nearly $13.5 billion, showing a gain of 16.34 percent over 2016 (see Figure 3). Smaller distributors saw an average increase of 0.89 percent, with total orders of approximately $9.8 billion.
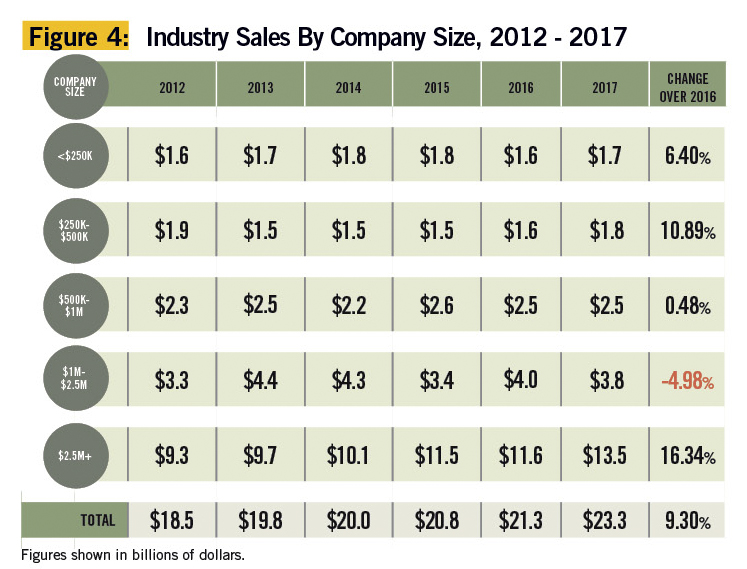
It wasn’t by much, but all small companies—except for those earning between $1 million and $2.5 million—saw an increase in sales in 2017. The most notable growth was found among companies in the $250,000 - $500,000 revenue segment; these reported 10.89 percent growth. However, sales from companies in the $1 million - $2.5 million segment declined by 4.98 percent compared to 2016, dragging down the average for the entire small-company category (see Figure 4).
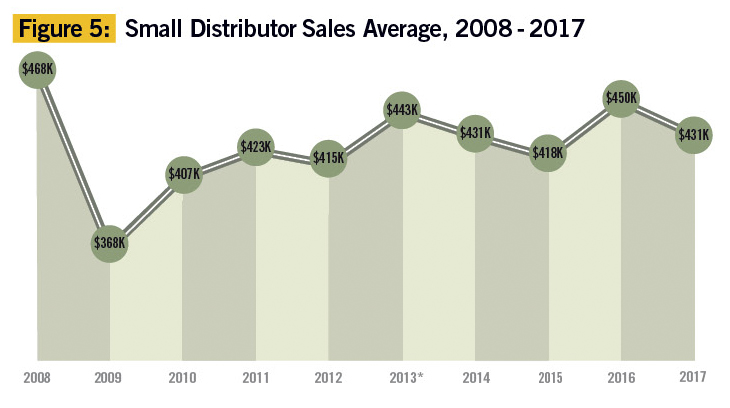
The average revenue for the 22,721 firms in the small-company segment was $430,982 ($449,835 in 2016), while the median was $150,000 vs. $176,750 in 2016 (see Figure 5).
A Second Source Of Revenue For Small Distributors
Promotional products continue to be a second revenue stream for many of the industry’s 22,721 small distributors—and large ones, too (see Figure 6).
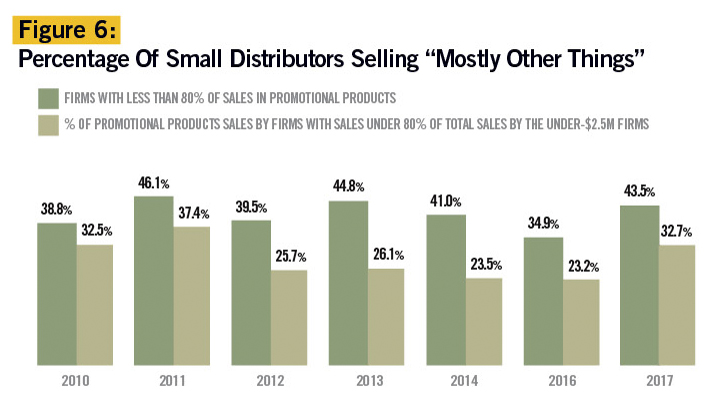
In 2017, more small companies that participated in the survey (43.5 percent) did less than 80 percent in sales of promotional products. However, these distributors generated 29 percent (up from 23 percent in 2016) of their revenue from promotional product sales, and 71 percent from another source.
Sales from these dual-revenue source distributors accounted for 32.7 percent of the sales volume in the small-company segment, a significant increase over 2016’s 23.2 percent.
The Profit Picture
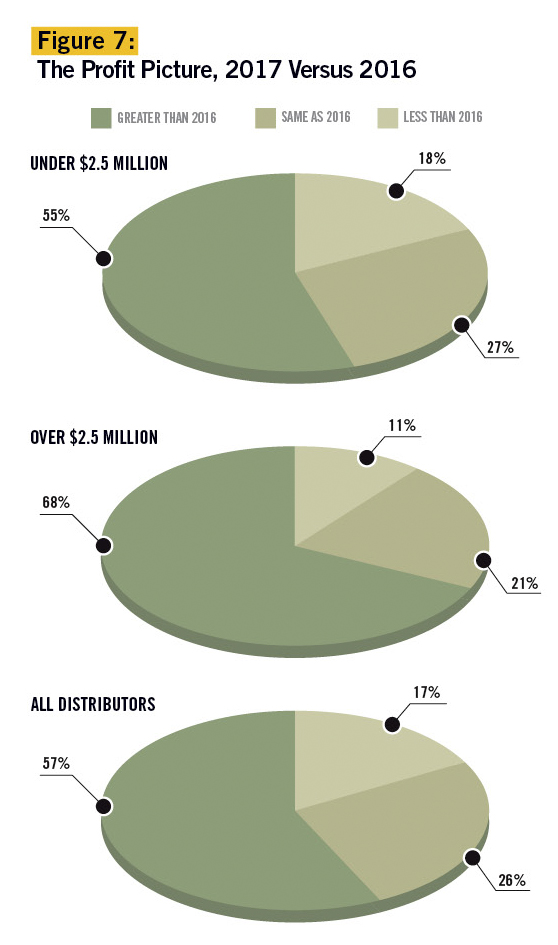
On average, the number of distributors reporting profit growth in 2017 increased slightly over 2016. Only 57 percent of distributors had greater profits over the prior year (54 percent). This was particularly true for small distributors, with 55 percent experiencing higher profits compared to 53 percent in 2016.
However, significantly more distributors in the large-distributor category saw a profit increase compared to 2016—68 percent vs. 60 percent (see Figure 7).
The Surge In Online Sales
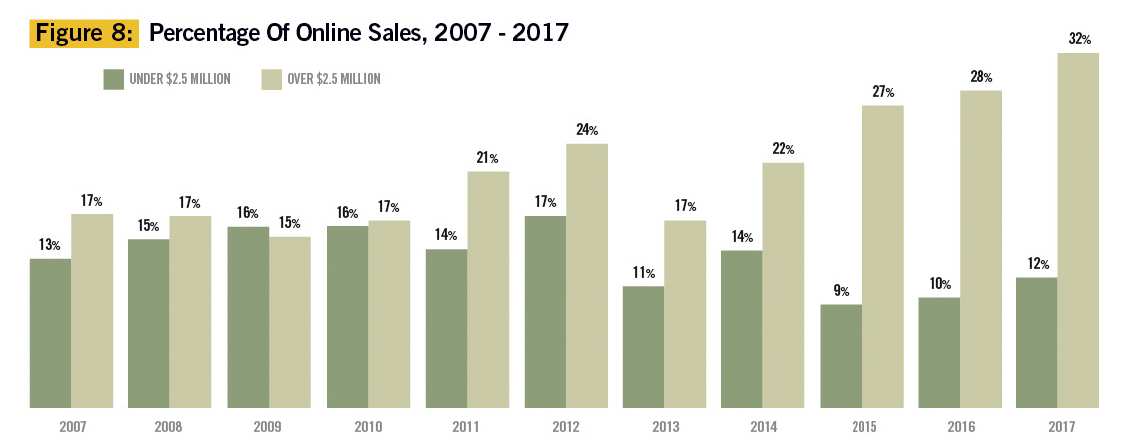
Online sales are defined as buys resulting from orders placed through an online store or website. These sales (not to be confused with salespeople transmitting orders online) are estimated to be $5,398,230,352 in 2017, or 23.2 percent of industry total sales (see Figure 8).
---
Why Was 2017 Such A Strong Year? Company Principals Weigh In.
by Tina Berres Filipski
Not too many in the industry were expecting such a large percentage increase in 2017 over 2016, but it didn’t surprise Janie Gaunce, president/CEO of Grapevine Designs in Lenexa, Kansas. At The PPAI Expo in January, she talked to many large-company distributor principals whose businesses, like hers, were up substantially year over year. “The average amount of growth for 2017 from those whom I spoke with was 18 to 20 percent,” she says. “And, most everyone I’ve spoken to in the first quarter of 2018 seems very optimistic. Our bookings going into the new year supported that, and the first quarter finish line year over year was unexpectedly strong.”
Gene Geiger, MAS+, CEO of Geiger in Lewiston, Maine, also wasn’t surprised about the uptick among larger distributors. “It does seem to me that we are seeing a continuation of a trend where the larger firms, which have scale and deep resources, are growing at the expense of smaller firms. Outside investors, such as private equity firm, are seeing and amplifying the consolidation opportunities.”
However, he’s not sure growth at this rate is a trend that will last. “While I would like to think our industry is growing at a rapid rate, a nearly 10 percent growth rate strikes me as a blip or an anomaly. Having said that, I think the larger firms and those in hot markets will continue to grow at these rates, while smaller firms will struggle.”
Gaunce is equally upbeat about the opportunities available in today’s market. “There is an energy about our industry that seems to be swirling upwards,” she says. “It’s a feeling. It starts with clients who are extremely optimistic about the business climate in general. When marketing budgets grow, our industry benefits. When fashion designers blow up apparel with logos; when cause marketing, festivals and event business grows; when employees are more rewarded and incentivized, the promotional products industry benefits. Perhaps these things, combined with the explosion of our own industry trade association marketing led by PPAI, individual distributor new business development efforts (noted in the survey) and increased distributor social media/marketing efforts have created a rising tide where you simply have to ask yourself, ‘Why couldn’t we hit 9.3 percent?’”
Larry Cohen, CAS, president of Axis Promotions in New York City, says the 2017 percentage increase is surprising but he has one possible explanation. “The 9.3 percent growth seems to be a big jump that I wouldn’t have anticipated, but the growth of the internet part of the industry may be picking up sales that weren’t otherwise being captured.”
Still, he thinks last year’s sharp growth is a deviation from the pattern. “From what I’m hearing from other distributors, most are not seeing that significant of growth—we are not in our own business, although we are doing well. So, I think those numbers are a bit of an aberration. Having said that, I hope this is the new normal as I think our industry has a strong role to play in the overall advertising and marketing world.”
Greg Muzzillo, president of Proforma in Independence, Ohio, considers the data from the perspective of his own thriving corporation, as well as what his distributor member-owners are experiencing. “A 9.3 percent increase for the entire industry, especially with the number of smaller distributors, sounds aggressive to me. That said, end users are wide open for business, have strong budgets and are looking for creative marketing and branding solutions, and they are seeking the increased efficiencies that sophisticated online programs offer.”
He adds, “We are seeing similarly strong growth, especially for our larger owners who are selling large accounts, large programs and growing their sales teams. It is an exciting time for well-equipped, larger and sophisticated distributors to grow.”
Jeff Lederer, president of supplier Prime Line in Bridgeport, Connecticut, sees two reasons for the large percentage increase in 2017 sales. “Distributor acquisitions must have played a big role in the increase for 2017—assuming they did not report same store sales,” he says. “In addition, ‘affiliations’ to distributor aggregators would have added to the increase as well. Both of these are positive for larger suppliers like alphabroder and Prime because we believe distributors—particularly the larger ones—want to partner more closely with full-service, one-stop-shop suppliers.”
Stan Dohan, MAS, president of supplier The Allen Company in Blanchester, Ohio, also believes distributor acquisitions played a part in the increase. “A number of established, sizable and well-known distributors made acquisitions of some distributors that were large in their own right. I believe they would tell you that these deals played a significant part in showing growth in 2017.”
David Nicholson, president of supplier Polyconcept North America in New Kensington, Pennsylvania, says, “Acquisitions certainly played a role in driving the higher growth rates for the large distributor segment. This would include several significant acquisitions that were announced throughout 2017—but also the moves of smaller distributors and sales account executives to franchise distributors. It’s difficult to put a number on the impact, but there is little question that a meaningful portion of distributor growth was derived from merger and acquisition activity. In my mind, this raises a question of how much true organic growth is actually occurring across the industry.”
For distributors, the data provided in this research report and others provides valuable tools for their businesses, but suppliers also see these reports as vital tools in their planning. “It helps us understand where the customer success is emanating from,” says Dohan. “In the case of 2017, it appears the very large distributors carried the growth
[while] the very important $1,000,000 to $2,500,000 distributor seems to be struggling. Perhaps the increased buying group influence is affecting this.”
Nicholson adds, “In terms of the overall growth, it provides directional guidance that assists us in planning for demand (inventory, capacity, hiring, etc.). More important, however, are the underlying shifts in distributor activity. For example, if the large-distributor segment is growing more quickly, this can alter how we think about our sales and marketing approach. Similarly, the acceleration of online sales reinforces the need for more significant digital investments and support. In the end, the value isn’t in the actual number, but [in] the trends and shifts over time among the various distributor segments. That is what is most valuable for us in this type of data.”
Tina Berres Filipski is editor of PPB.
---
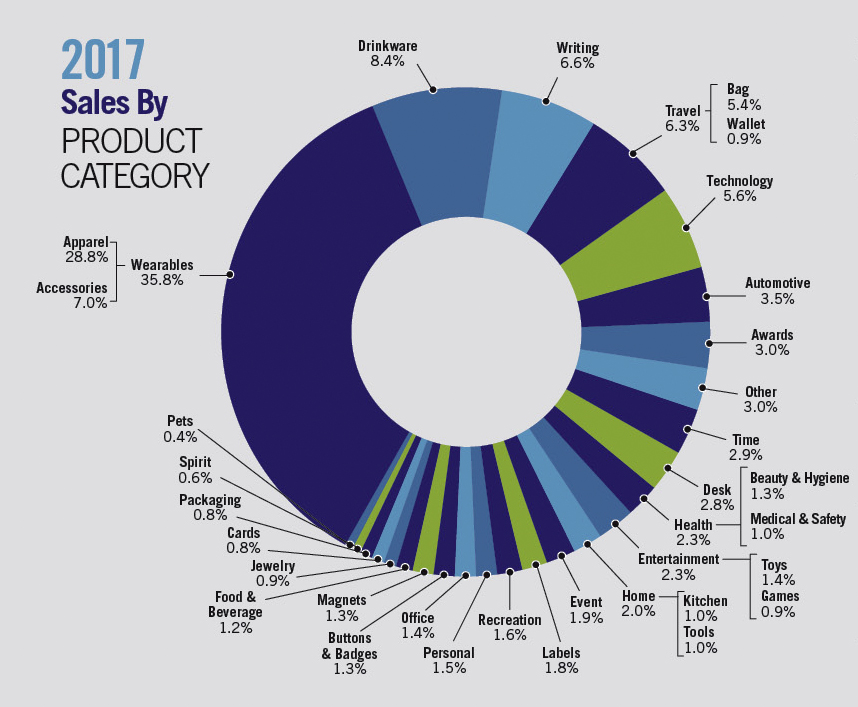
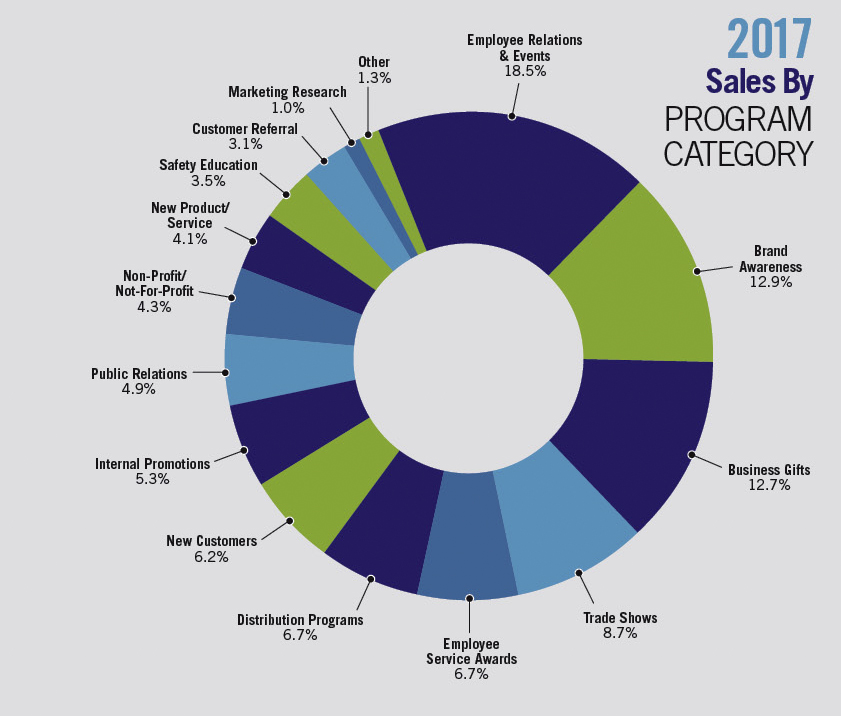
Top Products And Programs In 2017
For decades, the product and program pie charts produced from data collected in PPAI’s annual Sales Volume Study have been two of the most popular tools used by both distributors and suppliers. This year, PPAI researchers increased the value of the data by providing separate sales percentages for a number of growing categories.
Wearables, comprised of all types of promotional apparel including shirts, jackets, shorts, hats, footwear, gloves and accessories, have long been the industry’s leading product category. For the first time, this year’s report separates sales in two new subcategories: Apparel and Accessories. Also, the Bags category has been renamed Travel and shows the total percentage of sales for bags and wallets separately.
Health is another new category that is comprised of Medical & Safety and Beauty & Hygiene products. Games and Toys are now subcategories under Entertainment, and Kitchen and Tools are subcategories of the Home category. For a full list of the types of products within each category, see the chart in the summary report at www.ppai.org/research.
Will 2018 Be Another Banner Year? Most Distributors Think So.
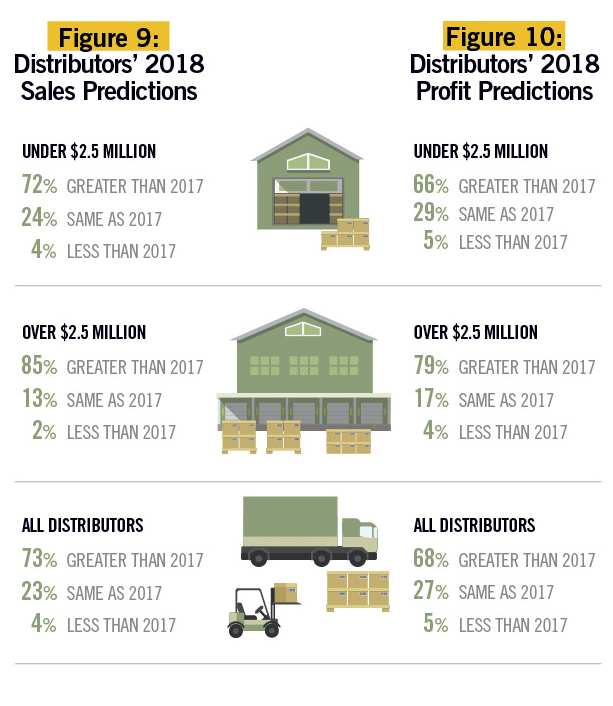
Nearly seven in 10 distributors who participated in the 2017 study are optimistic about both sales and profits for 2018, especially large distributors (see Figure 9).
Compared to predictions made for 2017, a greater number of large distributors feel bullish in their 2018 sales predictions, while smaller distributors seem more cautious about what the year holds. Read the anecdotal thoughts and predictions from a sampling of distributor business owners beginning on page 50.
Likewise, nearly seven in 10 distributors expect higher profits in 2018 (see Figure 10).
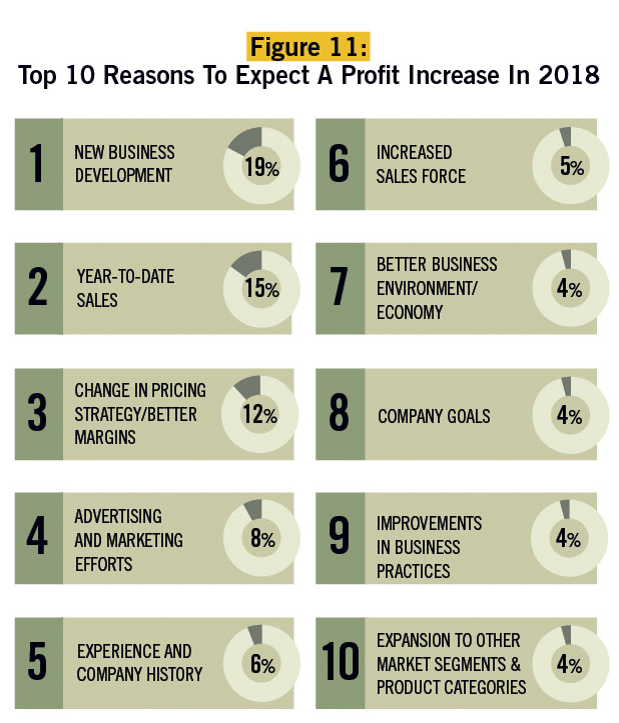
About one in five companies expecting greater profits in 2018 based their predictions on new business development efforts. Many also considered increased sales during the first quarter of 2018, while others have implemented changes in their pricing strategy to increase profit margins. Only four percent of those 764 distributors who predicted higher profits and answered this question attributed their expectations to the current state of the economy (see Figure 11).
Michaela Mora is principal of Relevant Insights, LLC.
Study Methodology
PPAI has researched and released industry sales data since 1965. This annual distributor sales study for PPAI is generally considered the most definitive and comprehensive of its kind in the industry based on actual sales reported by U.S. promotional consultant companies. In 2017, the survey was conducted by Relevant Insights LLC, an independent market research agency, on behalf of PPAI.
To compile the 2017 Estimate of U.S. Distributors’ Promotional Products Sales for PPAI, the survey was distributed both via email and mail to more than 25,000 distributors, both PPAI member and nonmember promotional consultant companies. As in the past, the sample was drawn from a merge/purge of several separate industry databases, including PPAI lists and the Industry Directory.
---
A Snapshot Of 2018 Year-To-Date
11 Business Leaders Reveal Their Progress So Far—And The Trends Influencing It
by Tina Berres Filipski
With the year’s first quarter in the rearview mirror, most distributors are feeling good about 2018.
Seven in 10 distributors who responded to PPAI’s 2017 annual Sales Volume Study are reportedly optimistic about 2018, with 85 percent of large distributors (those with annual sales over $2.5 million) and 72 percent of small distributors (those with sales under $2.5 million) expecting sales this year to be higher than 2017.
PPB asked a sample of distributor principals to share their thoughts on their business year to date, plus their anecdotal forecast for year end, and insights on the biggest trends and issues affecting their business.
Small Distributors

Teresa Beaudoin
Chief Operating Officer
Already Gear, Inc.
(PPAI 268451)
Dallas, Texas
Company Founded: 2000
Key Markets Served: Education, city government, business-to-business, churches, teams, individuals
Types Of Services Offered: Custom imprinting on just about anything
How is your business faring so far toward meeting 2018 goals? We are moving slowly this first quarter—we had a major setback that we are working around. We may not meet our financial goals for the first quarter, but the setback has caused us to restructure and add a new strategy.
Where do you see your company by year end and how does that compare to 2017? We hired four new employees in 2017 [a total of nine full-time employees, plus eight independent contractors] so there is still a learning curve, but our new team dynamic has created a ripe environment for exponential success.
What trends or issues are having the biggest impact on your business and why? Companies wanting to buy more retail-type items have caused us to think outside the box and seek relationships with manufacturers who understand the retail market. It has also moved us into the supplier role as we have developed two new products for the market.
 Seth Weiner, MAS
President/CEO
Sonic Promos
(PPAI 288270)
Gaithersburg, Maryland
Company Founded: 1997
Key Markets Served: Commercial/residential real estate, financial sector, events and recognition programs, health and wellness, company stores and engagement programs
Types Of Services Offered: Design, fulfillment, company store creation, advertising and promotional items
How is your business faring so far toward meeting its 2018 goals? Our business is currently up 15 percent.
Where do you see your company by year end and how does that compare to 2017? We expect to maintain our percentage to meet an all-time company high in sales for 2018.
What trends or issues are having the biggest impact on your business and why? We have seen a number of clients looking to implement bid and RFQ processes with the hope of saving on the bottom line. Businesses that have implemented these processes with a focus on keeping brand identity intact have found ways to save money because they are working consistently with us to create programs that best support their brands and product needs. Companies that are focused on bottom-line savings only have learned quickly that saving a few pennies is not worth it if they wait for all the bids to come in to submit the order and then realize the order needs to be rushed. In that case, they pay 20 percent more when they could have placed the order a week earlier with no rush and ground freight.

Patrick Black, MAS
President/CEO
Perfect Imprints
(PPAI 310979)
Fort Walton Beach, Florida
Company Founded: 1999
Key Markets Served: Perfectimprints.com is an ecommerce-based promotional products agency serving a variety of nationwide client markets.
Types Of Services Offered: Promotional products and custom apparel comprise the majority of sales, but the company also offers additional marketing services such as graphic design and web design.
How is your business faring so far toward meeting its 2018 goals? On the heels of a record year in 2017, this year is off to a great start. Thus far, 2018 is proving to be our most profitable year yet. With a bigger focus on meeting client goals and offering additional marketing services, we have seen steady and healthy growth.
Where do you see your company by year end and how does that compare to 2017? By year end, I expect my company will be up 10 to 15 percent in top-line sales.
What trends or issues are having the biggest impact on your business and why? In 2018, I have seen a trend of companies dedicating more money in their budgets for promotional products as well as opting for higher-quality items. This trend has led to higher-dollar orders. While my company initially attracts new customers to our website through ecommerce, ultimately our goal is to develop a relationship with those customers and turn them into long-term clients. This process of getting to know our clients has had the biggest impact on our growth.

Raman Agarwal
President/ CEO
Akran Marketing
(PPAI 228797)
Ottawa, Ontario
Company Founded: 2000
Key Markets Served: Private and public (educational, federal, provincial and municipal governments, Fortune 1000 corporations, financial sector, natural resources)
Types Of Services Offered: Akran Marketing is a full-service promotional distributor offering silk screening, embroidery, warehousing, fulfillment, pick and pack, and ecommerce.
How is your business faring so far toward meeting its 2018 goals? Really well. We are very pleased with the progress toward our goals in 2018. So far, we have seen a 25 percent increase in our revenues, which we find remarkable and rewarding.
Where do you see your company by year end and how does that compare to 2017? We see our company continuing its growth path, and by year end we should see a 30 percent increase in our revenues, which is pretty good compared to 2017 and to other distributors’ performance.
What trends or issues are having the biggest impact on your business and why? Even though we offer 24/7 service, we are finding that clients are getting more and more demanding and expecting faster delivery and service from us. Also, they are looking for more technology products that they can use all the time.
Mid-Sized Distributors

Janie Goldberg
President
Omnisource Marketing Group
(PPAI 146491)
Indianapolis, Indiana
Company Founded: 1989
Key Markets Served: OmniSource Marketing clients include the world’s largest food and beverage company, largest shopping mall owner, large automakers/OEMs, global technology companies and top universities. Utilizing an agency service model, our team actively engages our clients’ teams at all levels—from procurement and branding at headquarters, to the brand-activation team at their most distant outpost.
Types Of Services Offered: We manage all aspects of branded merchandise for our clients. From ideation and conception, to brand identity, to sourcing and supply chain compliance, and from warehousing, fulfillment and kitting, to cloud-based procurement solutions that are hard-wired into client ecosystems. We sit at the planning table to develop strategy with branding leaders—then execute myriad process points, until branded merchandise magically appears across the globe, at countless points of brand activation.
How is your business faring so far toward meeting its 2018 goals? We continue to deliver on year-over-year revenue growth, having doubled in size in the past five years. Because of our unique agency model, we grow by referral, not acquisition. We’re on target to meet our 2018 growth and financial goals.
Where do you see your company by year end and how does that compare to 2017? We plan to have a repeat year with 15 - 20 percent sales growth, which will take our billings to over $20 million for the first time. We’ve come a long way fast by finding and onboarding new clients—2017 saw a $3 million jump in revenue, from a record-setting $14 million in 2014.
What trends or issues are having the biggest impact on your business and why? If a company isn’t growing, it’s dying—and we repeatedly execute a new business plan that delivers stunning results. Growth doesn’t fly like an arrow, however. It moves like a caterpillar. When our new business team moves forward to onboard a client, it sends waves through our company where other teams and departments must then stretch to keep up. I lead an amazing team who somehow embraces 20 percent plus growth year over year, without requiring an equivalent growth in head count. My company grows 100 percent by referral—largely based on my personal commitment to always keep the customer promise. It is imperative that we execute flawlessly for both new and existing clients, to keep those referrals coming.
Scaling up for sustainable business growth isn’t as simple as growing sales volume. Growth of top-line revenue warrants infrastructure growth everywhere—finding talent and training them, developing them into leaders, finding space to house them. And that’s just on our team—equally important is supplier development, where we continue to recruit industry suppliers whose values mirror ours and then coach them to thrive in our unique business model.
While onboarding new business might sound like a largely customer-focused endeavor, integrating 15 to 20 percent annual business growth into a lean, performing enterprise demands time and thought, too.
As much as I’d like to devote my free time to new clients directly, I have to realize that budgeting time to grow my service team, train newbies to our industry and meet with space planners to be able to grow our office space to accommodate them is without question an essential, albeit indirect, act of service to our clients. I find myself and my team networking at more industry events and looking for game-ready talent who can quickly join our roster and serve our clients. We were named one of PPB’s Greatest Companies To Work For two years back—and I continue to push us to always be an employer of choice so that we not only retain our talent, but so they refer their friends.
How do I spend my days? What are the issues that affect my business? I’m training a caterpillar to move more like an arrow.

Brian Haner
Founder/CEO
Image Source, Inc.
(PPAI 195953)
Kirkland, Washington
Company Founded: 1998
Types Of Services Offered: Event merchandise, uniform programs, online stores, gift with purchase, product launches and safety programs
How is your business faring so far toward meeting its 2018 goals? After a record year in 2017, Q1 of 2018 began a bit slow and ended flat comparatively.
Where do you see your company by year end and how does that compare to 2017? We are forecasting five to 10 percent annual growth in 2018.
What trends or issues are having the biggest impact on your business and why? The biggest opportunities are mentoring, growing, educating and supporting our sales teams. We are doing big things this year with experience marketing and customer events to give our clients the very best customer experience. As a founding member of Reciprocity Road [a distributor buying group], we gain enormous value with member collaboration, buying power, supplier partnerships and shared resources. Our biggest challenges are maintaining our best workplaces’ culture as we grow rapidly, staying fresh with new technology and online program opportunities, and differentiation.

Stephanie Friedman
Vice President of Sales and Marketing
City Paper Company
(PPAI 654062)
Birmingham, Alabama
Company Founded: 1897
Key Markets Served: Retail, financial, manufacturing, hospitality and food/beverage
Types Of Services Offered: Promotional marketing products, retail packaging, print services, marketing and brand consultation, graphic design, ecommerce, warehouse and distribution
How is your business faring so far toward meeting its 2018 goals? Q1 is usually a slower quarter as we are coming out of the holidays and clients are using up their year-end budget dollars. This year has proved different as we have seen a definite uptick in activity, quotes, projects and orders. We plan conservatively for Q1 every year, and this year particularly we are very pleased with where we are sitting in comparison to Q1 of years prior.
Where do you see your company by year end and how does that compare to 2017? We are anticipating an increase in business for 2018 in all areas of our service offerings. We have already secured a number of significant new contracts for 2018 and even into 2019. These contracts cover a variety of our service lines, including promotional products, packaging, graphic design services, ecommerce and warehousing services. 2017 was a very successful year for City Paper Company—in fact, it was one of our top years in our 120 years of business. Our goal for 2018 is to stay focused, work smart and work hard simultaneously, utilize creative prospecting methods and continue to be proactive for our amazing customers. If we do these things well, our year end will reflect strong growth over 2017.
What trends or issues are having the biggest impact on your business and why? The methods by which people purchase goods today is having the biggest impact on the retail packaging side of our business. We all know that Amazon is dominating the online purchasing world. As a result, we must think more creatively and consultatively about how we approach our online retailer customers, as well as our storefront customers who compete with the online retailers. It’s more imperative than ever to make a great impression when we are given the opportunity, and the responsibility lies with us to guide our clients into making conscious decisions when it comes to their brand. The world is just going to continue to evolve in the way people buy, and it’s our job to ensure we are adapting along the way.
Large Distributors

Marc Simon
CEO
HALO Branded Solutions
(PPAI 106462)
Sterling, Illinois
Company Founded: 1952
Key Markets Served: All markets
Types Of Services Offered: All promotional products and recognition products and services.
How is your business faring so far toward meeting its 2018 goals? [We are] ahead of budget.
Where do you see your company by year end and how does that compare to 2017? Significantly ahead of budget.
What trends or issues are having the biggest impact on your business and why? [Trends include the] increasingly sophisticated demands of organizations who purchase promotional products, and industry consolidation.

Jon Sloan
CEO/Managing Partner
Mercury Promotions & Fulfillment
(PPAI 261357)
Sterling Heights, Michigan
Company Founded: 1996
Key Markets Served: All markets
Types Of Services Offered: Branded merchandise; digital storefront solutions; sweepstakes; contests and game promotions; loyalty, incentive and recognition management; warehouse and fulfillment; print management
How is your business faring so far toward meeting its 2018 goals? Mercury is off to an extraordinary start in 2018. We are 20 percent ahead of budget year to date in comparison to 2017. We attribute this to new client acquisition and smart marketing solutions.
Where do you see your company by year end and how does that compare to 2017? We are currently trending 20 to 30 percent ahead of 2017.
What trends or issues are having the biggest impact on your business and why? Clients are being required to do more with fewer internal resources and are asking companies like Mercury to do more for them. Mercury provides a center of excellence enabling our clients to manage all their corporate assets and materials exclusively through us. This trend has had a very positive impact on our business. To our clients, we are easy to do business with. The only negative trend that can affect our business or any other is when a current client—for whom you provide extraordinary creativity and service—RFPs your business to try and secure lower pricing while requiring the same level of service or higher. We have a great formula in place to provide great service at a fair cost. We do not have a formula in place to provide great service for free.

Jim Childers
President
BrandVia
(PPAI 105536)
San Jose, California
Company Founded: 2003
Key Markets Served: With representation up and down the California coast, our client base is rich with technology, entertainment and professional services clients. With many of our clients leading the way in their own industries, we at BrandVia are driven to lead the way in ours.
Types Of Services Offered: BrandVia is a full-service brand engagement company. Our 30-plus unique teams bring various skill sets to their projects in order to deliver memory-making magic rather than just a logo on a pen. We have been very successful working to create gift experiences that go beyond the gift itself.
How is your business faring so far toward meeting its 2018 goals? We are tracking ahead of projections for Q1 2018. The team at BrandVia is excited to be where we are in our space. Part creative and part analytical, our innovative team feels fortunate to be headquartered in the Bay Area with its heavy concentration of inspired thinkers.
What trends or issues are having the biggest impact on your business and why? We find clients are showing a continued interest in their own talent; how they can engage with them from the early recruitment stage, to onboarding, through to retention and recognition. Another trend we have identified with many of our clients, both large and small, is the desire to stretch around the world to their global partners and locations; the desire to provide brand consistency across their teams no matter where they are or what umbrella they are under.

Jason Robbins
CEO
ePromos Promotional Products, Inc.
(PPAI 212648)
St. Cloud, Minnesota
Company Founded: 1998
Key Markets Served: We serve all markets.
Types Of Services Offered: We provide promotional products and services related to helping clients distribute branded merchandise.
How is your business faring so far toward meeting its 2018 goals? ePromos is beating its 2018 goals.
Where do you see your company by year end and how does that compare to 2017? In 2018 we should surpass our 2017 performance.
What trends or issues are having the biggest impact on your business and why? The trends we are seeing are new buyers moving towards full or partial use of our website to shop for items. What I mean is new buyers like to self-serve entirely or use our website along with human service to meet their needs. We see technology products as an important segment. I also note that some of the big players just keep getting bigger consistently each year.
---
Tina Berres Filipski is editor of PPB.